Live calcium imaging to monitor T cells activation using Inscoper liveRATIO

Live calcium imaging to monitor T cells activation using Inscoper liveRATIO

When stimulated by the environment, many cell types use calcium signals for intracellular processing of information and induction of appropriate biological responses through activation of specific gene expression programs. For instance, calcium transients are responsible for the immune cells activation. In this application note, we will image calcium transients in γδ T cells to characterize their activation following the phospho-antigens presentation. All this experiment is realized using Inscoper liveRATIO, a tailored solution for ratiometric imaging.

CALCIUM SIGNALING IN T LYMPHOCYTES

The transduction of signals from the outside to inside cells is mediated by second messengers. These key actors of cell signaling could be nucleotides, lipids, free radicals, or ions. All of them bind to specific targets to induce downstream signals with specificities. For example, ions have the particularity to induce a fast response after signal induction. Calcium is a ubiquitous secondary messenger that regulates a wide spectrum of pathways like cell survival, proliferation, activation, neurogenesis, cell movement, muscle contraction, or neuronal synapse transmission (Paemeleire et al, 2000; Berridge et al, 2000, 2003; Clapham, 2007; Grienberger & Konnerth, 2012; Humeau et al, 2018; Zumerle et al, 2019).

Calcium plays a major role in the activation of T cells. These lymphocytes are a class of white blood cells that play an important role in the adaptive immune response with the particularity to present a T-cell receptor (TCR) on their surface to detect the presence of antigens. Under basal conditions, resting lymphocytes maintain an intracellular low concentration of calcium (Vig & Kinet, 2009). However, antigen recognition by TCR induces its activation, characterized by a rapid increase of the intracellular calcium level.

Activated T cells are then able to participate in the immune response according to their type: cytotoxic T (CD8+) cells destruct infected cells/pathogens, Helper T (CD4+) cells activate other immune actors, regulatory T cells (Treg) preventing the activation of autoimmune lymphocytes, natural killer T cells (NKT) secrete cytokines and lysing antigenic targets. Some other T cells are considered “unconventional”, like MAIT or γδ T cells. Coordination of all these cell types is necessary to allow the success of the immune response.

Lymphocytes are a central component of immune defense mechanisms. Their activations are one of the key steps needed for the immune response. Exploration of this complex physiological phenomenon can be done using ratiometric imaging monitoring calcium transients (Balagopalan et al, 2011). This technique could provide researchers with a way to improve the understanding of immune cell activation, and explore pathophysiological disorders.

INSCOPER LIVERATIO, THE MODERN AND VERSATILE SOLUTION FOR RATIOMETRIC IMAGING

Inscoper liveRATIO is a complete microscopy solution for ratiometric imaging. The product consists of a software and hardware package compatible with advanced video microscopes used in life science (Figure 1).

LiveRATIO_interface

Figure 1: Interface of the Inscoper software
Overview of the Inscoper user interface used to visualize the acquisition sequence. Here, cells were labeled with Fura-2. Images can be observed using a LUT dedicated to ratiometric imaging. A large panel of forms is available to select ROIs (Regions Of Interests). These areas will be used to monitor the evolution of the raw and rationalized fluorescence signal. All generated data can be exported in .tif for images, .csv for graphics and .avi for videos. Metadata is linked to each image.

Incorporating a specially-designed electronic unit to control the microscope stand and third-party devices, the Inscoper liveRATIO provides a new user experience for ratiometric applications with improved technical performance, full system integration, and ease of use. The core of Inscoper technology eliminates any software latency when controlling the overall microscopy system. Compared to conventional approaches, it increases the temporal resolution which is a major advantage for applications in live cell imaging. Besides controlling the different motorized elements of the system, the Inscoper liveRATIO offers researchers an elegant and full-featured graphical interface to monitor the evolution of the fluorescence signals in their biological samples thanks to real time image processing (Figure 2). Inscoper liveRATIO is the new state-of-the-art solution for FRET experiments and ratiometric imaging (ions concentration monitoring, intracellular pH measurement, …) using fluorescent probes.

liveRATIO-system

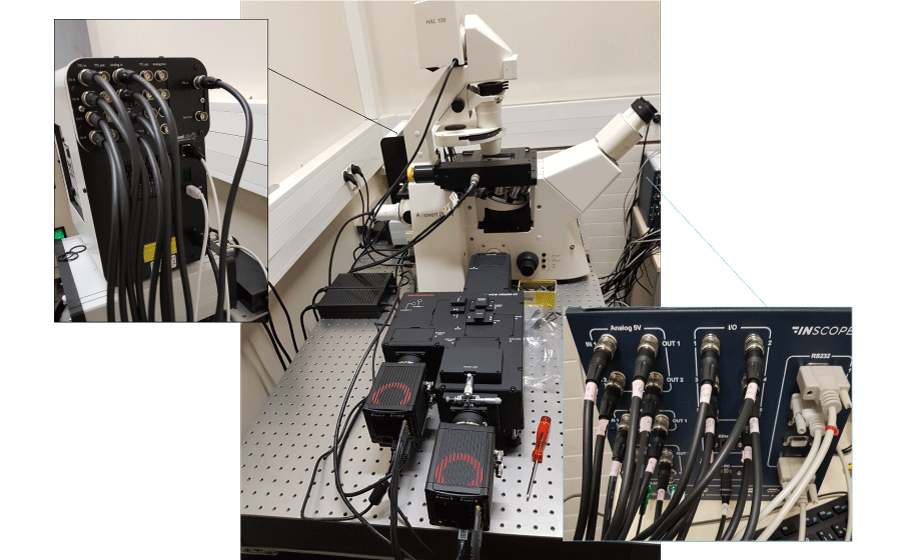
Figure 2: Experimental setup for calcium ratiometric imaging equipped with Inscoper liveRATIO

RATIOMETRIC IMAGING OF CALCIUM TRANSIENTS

Objectives

Here, we want to characterize the activation of γδ T cells following phosphoantigen presentation. For that, we will monitor the calcium transients in lymphocytes.

Material 

This experiment was realized in collaboration with the microscopy facility MicroPICell (Nantes, France). A Leica DMI 6000B microscope (Leica, Wetzlar, Germany) with HC Plan Apo 20x 0.70 NA (506166; Leica) was used (Figure 2). For this experiment, the camera was a digital CMOS Orca Flash 4.0 (C11440; Hamamatsu Photonics, Hamamatsu, Japan) and the light engine was from CoolLED (pE-800fura; CoolLED, Andover, UK). Microscope control, acquisitions and live image processing were performed with Inscoper liveRATIO (INSCOPER, Cesson-Sévigné, France).

Method

γδ T cells were labeled with Fura-2 AM (F1201; Thermofisher, Waktham, MA, USA), a fluorescent probe with a high affinity to free intracellular calcium. Its spectral properties in the presence of low calcium concentrations (excitation max = 362 nm, emission max = 512 nm) differ from those during high calcium conditions (excitation max = 335 nm, emission max = 505 nm). Excitation at 340nm and 380nm can respectively image with calcium bound and free fluorescent probes. During acquisition, phospho-antigens were manually added in the medium of lymphocytes, and fluorescence was monitored. The same experiment has also been performed using DMSO (used for Fura-2 dilution), as a negative control.

Results

Many dyes are used to perform calcium imaging according to their properties (ability to bind calcium or to passively diffuse across plasma membrane, excitation/emission wavelengths, intensity, brightness, and stability). Moreover, imaging could be performed using non-ratiometric (more convenient and faster, but not suited for quantification) or ratiometric methods (more complicated but fully adapted for quantitative measurements).

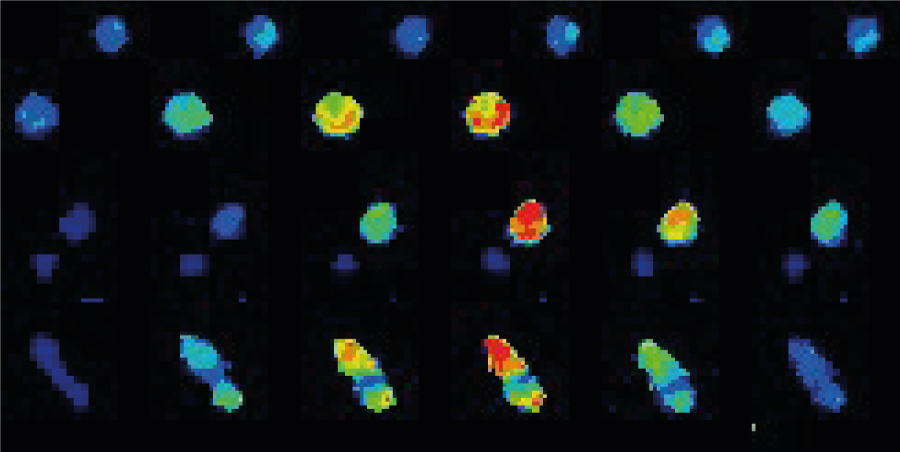
 Fura-2 AM was preferred in this experiment due to (i) its ratiometric properties and (ii) its ability to diffuse across plasma membranes. Briefly, Fura-2 AM needs to be excited sequentially with two different wavelengths: 340 (with bound calcium) and 380 nm (free) with only one emission at 510 nm. Both signals are rationalized for quantification. Under basal conditions, intracellular calcium concentration remained low in all resting lymphocytes. When DMSO or phospho-antigens (PA) was added to the cell medium, a slight and transient increase of the ratio 340/380 was observed. No changes in the 340/380 ratio were observed in DMSO-treated T cells in the whole experiment. However, PA-treated lymphocytes rapidly exhibited an increase of this ratio as shown on 2D images, surface plots (Figure 3A), or on kymographs (Figure 3B). Measurement of the 340/380 signal revealed a 32.71 ± 0.07 % increase of the ratio in PA-treated cells, despite the ratio remaining stable in DMSO-treated cells (Figure 3C). These findings validated the activation of γδ T cells following PA stimulation.

application-note-live-ratio-figure-3

Figure 3: T cells activation monitored by ratiometric imaging with the Inscoper liveRATIO

(A) Representative images of γδ T cells labeled with Fura-2 with DMSO or phospho-antigen (PA) stimulation. Surfaces plots are extracted from each dashed square. Scale bar = 100µm. (B) Kymograph representing the evolution of the fluorescence intensity as a function of time. The black arrowhead represents the addition of DMSO or PA in the medium. (C) Calcium fluctuation induced by DMSO or phospho-antigen on γδ T lymphocytes labeled with Fura-2. The black arrowhead represents the addition of DMSO or PA in the medium. Data are expressed according to the mean ± SEM.

Summary

Inscoper liveRATIO offers biologists and videomicroscope users the opportunity to characterize the activation of Fura 2-labeled immune cells following stimulation. This solution is a perfect tool for ratiometric (ion concentrations, pH measurement) and FRET (protein-protein interactions) imaging on a wide range of biological samples. Real time processing allows the observation of all dynamic modifications that can occur during imaging sessions with an optimized spatiotemporal resolution. More than acquisition and processing software, the Inscoper liveRATIO can control all devices of the microscopy system to combine multidimensional and complex acquisitions, including temperature and CO2 settings of an incubator chamber or syringe pumps for microfluidic experiments. The next improvement for ratiometric imaging applications would be to perform cell tracking in order to monitor fluorescence in real time, without being affected by cell mobility.

ACKNOWLEDGEMENTS

We acknowledge the IBISA MicroPICell facility (Biogenouest), a member of the national infrastructure France-Bioimaging supported by the French National Research Agency (ANR-10-INBS-04). We particularly thank Philippe Hulin and Steven Nedellec for their technical, methodological, and scientific support. We also thank Chirine Rafia and Marie Giraud (CRCI2NA, Nantes, France) for the cell preparation and labeling.


Bibliography

  1. Balagopalan L, Sherman E, Barr VA & Samelson LE (2011) Imaging techniques for assaying lymphocyte activation in action. Nat Rev Immunol 11: 21–33
  2. Berridge MJ, Bootman MD & Roderick HL (2003) Calcium signalling: dynamics, homeostasis, and remodelling. Nat Rev Mol Cell Biol 4: 517–529
  3. Berridge MJ, Lipp P & Bootman MD (2000) The versatility and universality of calcium signalling. Nat Rev Mol Cell Biol 1: 11–21
  4. Clapham DE (2007) Calcium Signaling. Cell 131: 1047–1058
  5. Grienberger C & Konnerth A (2012) Imaging Calcium in Neurons. Neuron 73: 862–885
  6. Humeau J, Bravo-San Pedro JM, Vitale I, Nuñez L, Villalobos C, Kroemer G & Senovilla L (2018) Calcium signaling and cell cycle: Progression or death. Cell Calcium 70: 3–15
  7. Paemeleire K, Martin PEM, Coleman SL, Fogarty KE, Carrington WA, Leybaert L, Tuft RA, Evans WH & Sanderson MJ (2000) Intercellular Calcium Waves in HeLa Cells Expressing GFP-labeled Connexin 43, 32, or 26. Mol Biol Cell 11: 1815–1827
  8. Vig M & Kinet J-P (2009) Calcium signaling in immune cells. Nat Immunol 10: 21–27
  9. Zumerle S, Calì B, Munari F, Angioni R, Di Virgilio F, Molon B & Viola A (2019) Intercellular Calcium Signaling Induced by ATP Potentiates Macrophage Phagocytosis. Cell Rep 27: 1-10
Microirradiation using Inscoper scanFRAP  for real-time DNA repair monitoring

Microirradiation using Inscoper scanFRAP for real-time DNA repair monitoring

Maintenance of the genome integrity is directly dependent on the spatiotemporal recruitment and regulation of the repair proteins at DNA damage sites. The alteration of this complex biological pathway could induce mutations or premature cell death. The real-time monitoring of this phenomenon can be done using a technique called laser microirradiation illumination with highly energetic photons focused towards the desired area to induce damages. Such an approach has become a powerful tool to explore the DNA repairment following laser-induced damage. This application note introduces the use of Inscoper scanFRAP solution to explore the kinetic of protein recruitment following laser-induced DNA damage.

Biological context

The integrity of genomic DNA is continually challenged by the exposition of genotoxic factors such as radiations, chemicals, reactive products of cellular metabolism or environment mutagens. One of them is ultraviolet light (UV) that can induce 100,000 DNA lesions per hour per exposed cell (Jackson & Bartek, 2009). All of them could lead to DNA single or double strands breaks. If they remain unrepaired, these pathological phenomena could induce mutations and subsequently cancer and/or cell death. To prevent these alterations, cells have  developed an efficient tool to repair DNA and restore its integrity as fast as possible.

Laser microirradiation can induce artificial DNA lesions to evaluate the recruitment of a large panel of repair enzymes (Figure 1). Used for the first time in 1980 (Cremer et al, 1980), it has become nowadays a key technique to study the involvement of DNA repair (Suzuki et al, 2011; Zentout et al, 2021; Kong et al, 2021).

dna-damage-response

Figure 1: DNA damage response
Cells are continuously faced with exogenous (chemicals, UV light, ionizing radiations) and endogenous (ROS, …) agents that can lead to DNA damage. When DNA is damaged, a large panel of proteins is recruited to repair this alteration. Unrepaired lesions could alter DNA integrity and lead to premature cell death, cancer or mutations.

Microirradiation with the Inscoper scanFRAP

Inscoper scanFRAP is a complete microscopy solution for photomanipulation and optogenetics. The product consists of a software and hardware package compatible with advanced video microscopes used in life science. Incorporating a specially-designed electronic unit to control the microscope stand and third-party devices, the Inscoper scanFRAP provides a new user experience for photomanipulation applications with improved technical performance, full system integration and ease of use.

Users benefit from a state-of-the-art solution to add photomanipulation and optogenetics experiments within their conventional acquisition sequences, allowing a full and smooth image workflow compatible with the other imaging techniques also implemented on their system. The core of Inscoper technology eliminates any software latency when controlling the overall microscopy system. It increases the temporal resolution, compared to conventional approaches, which is a major advantage for applications in live cell imaging (Figure 2).

scanFRAP interface

Figure 2: Interface of the Inscoper software
Overview of the Inscoper software used to manage the acquisition sequence with multidimensional parameters including timelapse, multiposition or/and tiling, Z-stack, multi-channels and photomanipulation for microirradiation, and FRAP
applications. All of these dimensions are fully customizable to be more suitable for user’s experiments.

Based on galvanometric mirror technology, the Inscoper scanFRAP is a microscopy solution for photomanipulation applications including FRAP, photoactivation or microirradiation. Here, this application note only focuses on microirradiation application. Researchers have full control of all laser settings. They can completely personalize and optimize the microirradiation areas, modulating in live the region of interest (ROI) in the software user interface. Faster acquisition speed allows to monitor biological phenomena after microirradiation with a very high temporal resolution,  such as the recruitment of repair proteins following laser-induced damage.

Microirradiation experiments

Objectives

Here, we want to characterize the recruitment of the ALC1 (chromodomain-helicase-DNA-binding protein 1-like) protein following laser-induced DNA damage. This protein is involved in DNA unpackaging to allow the recruitment of other repair enzymes (Sellou et al, 2016).

Material 

A Nikon Ti2 Eclipse microscope (Nikon, Tokyo, Japan) with a Plan Apo λ 60x 1.4 NA oil immersion objective (MRD01605; Nikon) was used. For these experiments, the camera was a digital CMOS ORCA-Fusion BT (C15440-20UP; Hamamatsu Photonics, Hamamatsu, Japan) and the light engine was from Lumencor (SpectraX; Lumencor, Beaverton, USA). Microirradiation was performed using Inscoper scanFRAP (INSCOPER, Cesson-Sévigné, France) with a 405nm laser source (L6Cc; Oxxius, Lannion, France).

Method

U2OS cells were transfected to overexpress ALC1 fused with GFP (Green Fluorescent Protein), resulting in an ALC1-GFP protein (GenBank AF537213.1,A). Nuclei were labeled using Hoechst 33342 (H3570; ThermoFisher Scientific, Waltham, USA) before imaging. For this experiment, the microirradiation was induced using the 405nm laser (100% intensity for 1 second) to induce DNA damages and the recruitment of ALC1-GFP protein at the injured area. This measurement allows to characterize the ALC1 protein dynamic, following laser-induced DNA damage. ALC1-GFP recruitment was monitored using a 488 nm excitation (exposure time: 100 ms and frame rate: 4fps).

Results

The laser microirradiation represents a powerful tool to monitor DNA repair with high temporal and spatial resolution. DNA lesions were induced following ROI (region of interest) previously defined using the Inscoper software. During the acquisitions, a progressive recruitment of ALC1-GFP protein could be observed over the entire length of the ROI (Figure 3A). Mean intensity of the fluorescent signal has been then measured on the damaged area. The signal from an unaltered ROI was also measured as control. A rapid increase of the signal was observed in the irradiated area, to remain stable in less than 10 seconds (Figure 3B). On the contrary, intensity from the control ROI appeared slightly decreased following the photomanipulation. ALC1-GFP accumulation could also be characterized by the width of the band (Figure 3C).

Figure 3: ALC1 recruitment following laser-induced DNA damage
(A) Representative image showing ALC1-GFP accumulation at sites of laser-induced DNA damage in U2OS cells. Area between the arrows has been damaged by a 405nm laser. The solid and the dashed boxes represent respectively the laser-damaged and the control area. (B) Quantified accumulation of ALC1-GFP following microirradiation (arrow) on laser-damaged (circles) and undamaged (squares) areas. (C) Normalized thickness of the ALC1-GFP band in the irradiated region following laser-induced DNA damage

interface-acquisition

Figure 4: Interface view of the Inscoper software during FRAP acquisition
Acquisitions are real-time monitored with images or graphics. The “Fire-on-Click” (bottom right part of the interface) can be activated at any moment to add a new ROI to photobleach while the acquisition is running.

Summary

The laser microirradiation on living cells helps to study the cellular response to DNA damages. The use of the Inscoper scanFRAP solution allows to monitor in real-time the recruitment of a wide spectrum of DNA repair proteins with high spatiotemporal resolution. It could also be useful to evaluate the impact of drugs on the maintenance of the DNA integrity. Laser microirradiation could be combined with other microscopy approaches to better characterize biological pathways involved during DNA repair. For instance, it could be coupled with FLIM (Fluorescence Lifetime Imaging Microscopy) to evaluate the cellular metabolic changes (Murata et al., 2019) or FRET (Fluorescence Resonance Energy Transfer) to characterize the kinetics of protein interactions (Lou et al., 2019).


Bibliography

  1. Cremer C, Cremer T, Fukuda M & Nakanishi K (1980) Detection of laser-UV microirradiation-induced DNA photolesions by immunofluorescent staining. Hum Genet 54: 107–110
  2. Jackson SP & Bartek J (2009) The DNA-damage response in human biology and disease. Nature 461: 1071–1078
  3. Kong X, Wakida NM & Yokomori K (2021) Application of Laser Microirradiation in the Investigations of Cellular Responses to DNA Damage. Front Phys 8: 1–8
  4. Lou J, Scipioni L, Wright BK, Bartolec TK, Zhang J, Masamsetti VP, Gaus K, Gratton E, Cesare AJ & Hinde E (2019) Phasor histone FLIM-FRET microscopy quantifies spatiotemporal rearrangement of chromatin architecture during the DNA damage response. Proc Natl Acad Sci 116: 7323–7332
  5. Murata MM, Kong X, Moncada E, Chen Y, Imamura H, Wang P, Berns MW, Yokomori K & Digman MA (2019) NAD+ consumption by PARP1 in response to DNA damage triggers metabolic shift critical for damaged cell survival. Mol Biol Cell 30: 2584–2597
  6. Sellou H, Lebeaupin T, Chapuis C, Smith R, Hegele A, Singh HR, Kozlowski M, Bultmann S, Ladurner AG, Timinszky G, et al (2016) The poly(ADP-ribose)-dependent chromatin remodeler Alc1 induces local chromatin relaxation upon DNA damage. Mol Biol Cell 27: 3791–3799
  7. Suzuki K, Yamauchi M, Oka Y, Suzuki M & Yamashita S (2011) Creating localized DNA double-strand breaks with microirradiation. Nat Protoc 6: 134–139
  8. Zentout S, Smith R, Jacquier M & Huet S (2021) New Methodologies to Study DNA Repair Processes in Space and Time Within Living Cells. Front Cell Dev Biol 9: 1–15
Confocal microscopy with Inscoper Solution using Confocal.nl technology

Confocal microscopy with Inscoper Solution using Confocal.nl technology

Live-cell microscopy is nowadays widely used to image and better understand the fundamental nature of cellular function and organization. The development of diversified microscopy approaches, such as confocal microscopy, allows to image a large spectrum of cellular dynamic events with high spatial and temporal resolution. Here we present a new opportunity for biology researchers to perform confocal experiments on a widefield microscope, using the imaging devices from Confocal.nl coupled with the Inscoper control and image acquisition solution.

Confocal microscopy for live-cell imaging

Live-cell imaging is used by scientists in a large spectrum of research fields, such as developmental biology, neurobiology, and cell biology [1]. It is commonly used to improve knowledge of biological function through the study of both cellular and intracellular dynamics. However, some limitations have to be controlled to guarantee the robustness of these experiments. Photobleaching and phototoxicity are significant problems, altering cell integrity and fluorescent signal detection. To prevent their appearance, it is important to limit as much as possible prolonged exposure time and high-intensity excitation light. Confocal microscopy can be used using a fast scanner to perform live-cell imaging [2], [3]. It provides researchers the ability to realize three-dimensional imaging of living cells and to improve the spatial resolution of their images, increasing the signal-to-noise ratio. Due to the high irradiance of laser beams in confocal microscopy, perfect synchronization and control of all devices of the microscope are required to guarantee the minimal exposure time of the biological samples.

Inscoper Solution to optimize the operating of the microscope

Inscoper is a full image acquisition solution for advanced video microscopes with fluorescence used in life science. Incorporating a specially-designed device, the Inscoper Solution provides a new user experience with improved technical performance, system integration and easy-to-use (Figure 1). 

Figure 1: View of the Inscoper software
Multidimensional acquisition sequences are planned using the user-friendly Inscoper software interface. Live preview of the sample could be observed at the left part of the screen. Here, both “Multichannels” and “Z-stack” dimensions are selected.

Many users believe that image acquisition speed is only determined by the camera frame rate and the slow response time of microscopy devices. In fact, latency generated by imaging software is the major factor that reduces the response time of the devices, thus slowing the acquisition. The core of Inscoper technology eliminates any software latency, consequently tripling the frame rate compared to conventional approaches for a classical multi-dimensional acquisition (Time, XYZ, Channels).

Confocal.nl products for super-resolution and fast scanning

Inscoper recently integrated in its solution the two confocal systems from Confocal.nl (https://www.confocal.nl; Amsterdam, Netherland): the NL5 and the RCM2 (Figure 2). 

Confocal.nl developed confocal microscopy approaches adapted for live cell imaging using low laser intensity. It prevents sample phototoxicity and photobleaching of fluorochromes. These innovative systems allow researchers to easily monitor long-term biological phenomena with fast acquisition speed, high spatial resolution without inducing sample alteration.

Figure 2: NL5 and RCM2 products from Confocal.nl controlled with Inscoper Solution
Confocal microscopy with Inscoper Solution using (A) NL5 and (B) RCM2. Both systems are controlled by the Inscoper Solution

NL5 is a camera-based fast line-scanning confocal system adapted for 3D live cell imaging with high sensitivity (up to 95% quantum efficiency) and resolution (170 nm after deconvolution, Table I). NL5 can convert an epifluorescence microscope into a fast-scanning confocal. It contains a slit pinhole that increases acquisition speed by scanning lines instead of individual points (25fps). NL5 can decrease the exposure time during acquisition and prevent both phototoxicity and bleaching. Thus, it appeared to be a cost-effective solution that could be coupled to any research microscopy via a c-mount interface.

RCM2 is a camera-based bidirectional re-scan confocal microscope (RCM). It is a standard confocal microscope extended with an optical re-scanning unit that projects the image directly on a camera [4]. After deconvolution, the resolution is further improved to 120 nm (Table I).

Here, a Nikon Ti2 Eclipse microscope (Nikon, Tokyo, Japan) with a Plan Apo λ 60x 1.4 NA oil immersion objective (MRD01605, Nikon) was used. For these experiments, the camera was a digital CMOS Orca Flash 4.0 (C11440; Hamamatsu Photonics, Hamamatsu, Japan) and the light sources were an Oxxius laser (L4Cc; Oxxius, Lannion, France) for confocal imaging and a light engine from Lumencor (Spectra, Lumencor, Beaverton, USA) for bypass imaging.

NL5 RCM2
Detector Camera Camera
Resolution with deconvolution 170nm 120nm
Sensitivity (% Quantum Efficiency) Up to 95% QE Up to 95% QE
Speed 25fps @ full frame 2fps @ 512x512px
View of Field 330×330µm (40x) 220×220µm (40x)
Optimized for… 40-100x 40x (with high NA), 60x, 100x
ByPass mode Yes (motorized) Yes

Table I: Comparison between NL5 and RCM2 system from Confocal.nl (data from www.confocal.nl)

Biological applications

First, NL5 was used to image nuclei from HeLa cells labelled with Hoechst. Images from bypass and confocal mode were taken and compared using the same microscope and camera (Figure 3). Confocal images presented a better x-y axis resolution compared to the bypass mode. For instance, compacted DNA (brighter spots observed in nuclei) exhibits more details with a confocal mode of the NL5 with an increase of the signal-to-noise ratio (SNR). It is important to note that this result could again be improved using a deconvolution protocol (resolution after deconvolution according to confocal.nl is 170 nm).

Figure 3: Two-dimensional confocal imaging using NL5 (Confocal.nl) controlled by Inscoper Solution
Fixed HeLa cells labelled with Hoechst (nuclei, gray). White arrows indicate condensed chromatin. Scale bar: 10µm.

NL5 was then used to image mitochondrial networks in fixed HeLa cells that were transfected with a GFP-fused mitochondrial protein and labelled with Hoechst (Figure 4). Using the Inscoper user interface, a multidimensional imaging sequence was performed, composed of a ”Multi-channels” acquisition associated with a Z-stack (step: 0.5µm). Once again, better lateral resolution and SNR were observed (Figure 4A). Three-dimensional (3D) projection could be performed with all Z-stack images using the open-source ImageJ software (https://imageJ.nih.gov/ij/) or others. Here, 3D visualization was realized with the ClearVolume plug-in (https://clearvolume.github.io/) of ImageJ (Figure 4B). The lateral view of the 3D projection appeared different between the two modes (Figure 4C). Indeed, z-axis resolution appeared better using confocal mode compared to bypass. For example, nuclei shape appeared more precise without the blurry diffusion of the signal observed with bypass. Similarly, mitochondrial spots appeared brighter with a higher SNR. Furthermore, NL5 can perform time-lapse acquisition or screen multiwell plates. It could also be coupled with other microscopy techniques that require fast imaging, like FRAP (Fluorescence Recovery After Photobleaching) for example.

In a second time, we observed BPAE cells labelled with MitoTracker and Hoechst (mitochondria and nuclei, respectively) using the RCM2 system. Inscoper Solution fully controls all the devices from the RCM2, except the Confocal/Bypass mode switch that is not motorized. On this system, this switch needs to be manually done using a handle on the device before starting the acquisition. The acquisition sequence basically starts in bypass mode to select the area of interest in the sample. Then, the user can switch to the RCM mode to perform high-resolution images.

Figure 4: Three-dimensional confocal imaging using NL5 (Confocal.nl) controlled by Inscoper Solution
Imaging of fixed HeLa cells transfected with mitochondria-GFP (mitochondria, green) and labelled with Hoechst (nuclei, blue). Z-stack has been performed under the control of Inscoper Solution. Resulting images are presented using 2D maximum Z-projection (A), 3D projection with top (B) and lateral (C) views using the CleanVolume plugin of ImageJ software. White arrows represent x,y,z axis orientation. Scale bar (2D image): 10µm. Dimensions (3D projections): 31x33x20µm.

Controlled by the Inscoper Solution, RCM2 succeeded in performing multidimensional images of the mitochondrial network from BPAE cells (Figure 5)

Moreover, time-lapse could also be realized using RCM2 to explore with a 170 nm resolution (120 nm after deconvolution) dynamic biological processes like mitochondrial network (genesis, fusion/fission/ movements, …) or cytoskeleton remodeling (microtubules or actin polymerisation/depolymerisation).

Figure 5: Mitochondrial network imaging using RCM2 (Confocal.nl) controlled by Inscoper Solution
Fixed BPAE cells labelled with MitoTracker (mitochondria, green) and DAPI (nuclei, blue). The area inside the square with dotted line is zoomed in the bottom left corner of the image. No deconvolution protocol has been performed here. Scale bar: 20µm (large image) and 5µm (zoomed image).

Summary

The two systems from Confocal.nl (NL5 and RCM2) have been added to the list of equipment fully controlled by the Inscoper Solution. Both confocal microscopy devices appeared to be perfectly suited for live cell imaging thanks to respectively their low phototoxicity and high sensibility (high SNR). Thus, the Inscoper Solution and Confocal.nl products are compatible with multiple microscope stands. This makes it very universal and allows it to work with basically any fluorescent microscope.


Bibliography

1. Jensen, E. C. Overview of Live-Cell Imaging: Requirements and Methods Used. Anat. Rec. 296, 1–8 (2013).
2. Axelrod, D., Koppel, D. E., Schlessinger, J., Elson, E. & Webb, W. W. Mobility measurement by analysis of fluorescence photobleaching recovery kinetics. Biophys. J. 16, 1055–1069 (1976).
3. Bayguinov, P. O. et al. Modern Laser Scanning Confocal Microscopy. Curr. Protoc. Cytom. 85, 1–17 (2018).
4. De Luca, G. M. R. et al. Re-scan confocal microscopy: scanning twice for better resolution. Biomed. Opt. Express 4, 1–13 (2013).

FRET & multi purpose shared system – Grenoble, France

FRET & multi purpose shared system – Grenoble, France

System description & applications

The system is a shared microscope used for different purposes: quantitative FRET imaging at the cell scale, fluorescence imaging over large scales, or fast imaging of micro-organisms.

Different methods are used depending on the project. The Inscoper software role for this system is to make the microscope simply usable at its best for different purposes: alternating excitation schemes, fast imaging with hardware cropping, tiling over mm.

Depending on the project different other options are used: time-lapse, channel control, z-stack, multi-position.

microscope device list

  • Microscope Zeiss Axiovert 200M
  • Light source CoolLED pE4000
  • 2x Camera Hamamatsu Orca Flash 4 v3
  • Stage Marzhauser with Tango controller
Laser-induced DNA damage within a 4D/5D acquisition sequence

Laser-induced DNA damage within a 4D/5D acquisition sequence

INSCOPER markets a laser illumination controller that allows photomanipulation experiments to be performed on a video microscope within a multidimensional acquisition sequence.

This 4′ video shows an image acquisition with 3 sequences: before, during and after laser micro-irradiation to observe the recruitment phenomenon.
The cells used are U2OS cells in an 8-chamber glass holder, transfected with ALC1-GFP and labeled with Hoechst at 37°C.

The steps are as follows :
1. Define an ROI for laser irradiation.
2. Set 3 sequences for the acquisition :
     a. Before irradiation: timelapse of 50 images & 1 channel;
     b. During irradiation: Photomanipulation settings;
     c. After irradiation: timelapse of 500 images & 1 channel.
3. Choose the storage location for the dataset.
4. Start the acquisition and confirm.
5. Monitor the progress of the acquisition.
6. Visualize data.

You can also watch this dedicated tutorial about how to calibrate the FRAP laser illumination controller.