When stimulated by the environment, many cell types use calcium signals for intracellular processing of information and induction of appropriate biological responses through activation of specific gene expression programs. For instance, calcium transients are responsible for the immune cells activation. In this application note, we will image calcium transients in γδ T cells to characterize their activation following the phospho-antigens presentation. All this experiment is realized using Inscoper liveRATIO, a tailored solution for ratiometric imaging.
CALCIUM SIGNALING IN T LYMPHOCYTES
The transduction of signals from the outside to inside cells is mediated by second messengers. These key actors of cell signaling could be nucleotides, lipids, free radicals, or ions. All of them bind to specific targets to induce downstream signals with specificities. For example, ions have the particularity to induce a fast response after signal induction. Calcium is a ubiquitous secondary messenger that regulates a wide spectrum of pathways like cell survival, proliferation, activation, neurogenesis, cell movement, muscle contraction, or neuronal synapse transmission (Paemeleire et al, 2000; Berridge et al, 2000, 2003; Clapham, 2007; Grienberger & Konnerth, 2012; Humeau et al, 2018; Zumerle et al, 2019).
Calcium plays a major role in the activation of T cells. These lymphocytes are a class of white blood cells that play an important role in the adaptive immune response with the particularity to present a T-cell receptor (TCR) on their surface to detect the presence of antigens. Under basal conditions, resting lymphocytes maintain an intracellular low concentration of calcium (Vig & Kinet, 2009). However, antigen recognition by TCR induces its activation, characterized by a rapid increase of the intracellular calcium level.
Activated T cells are then able to participate in the immune response according to their type: cytotoxic T (CD8+) cells destruct infected cells/pathogens, Helper T (CD4+) cells activate other immune actors, regulatory T cells (Treg) preventing the activation of autoimmune lymphocytes, natural killer T cells (NKT) secrete cytokines and lysing antigenic targets. Some other T cells are considered “unconventional”, like MAIT or γδ T cells. Coordination of all these cell types is necessary to allow the success of the immune response.
Lymphocytes are a central component of immune defense mechanisms. Their activations are one of the key steps needed for the immune response. Exploration of this complex physiological phenomenon can be done using ratiometric imaging monitoring calcium transients (Balagopalan et al, 2011). This technique could provide researchers with a way to improve the understanding of immune cell activation, and explore pathophysiological disorders.
INSCOPER LIVERATIO, THE MODERN AND VERSATILE SOLUTION FOR RATIOMETRIC IMAGING
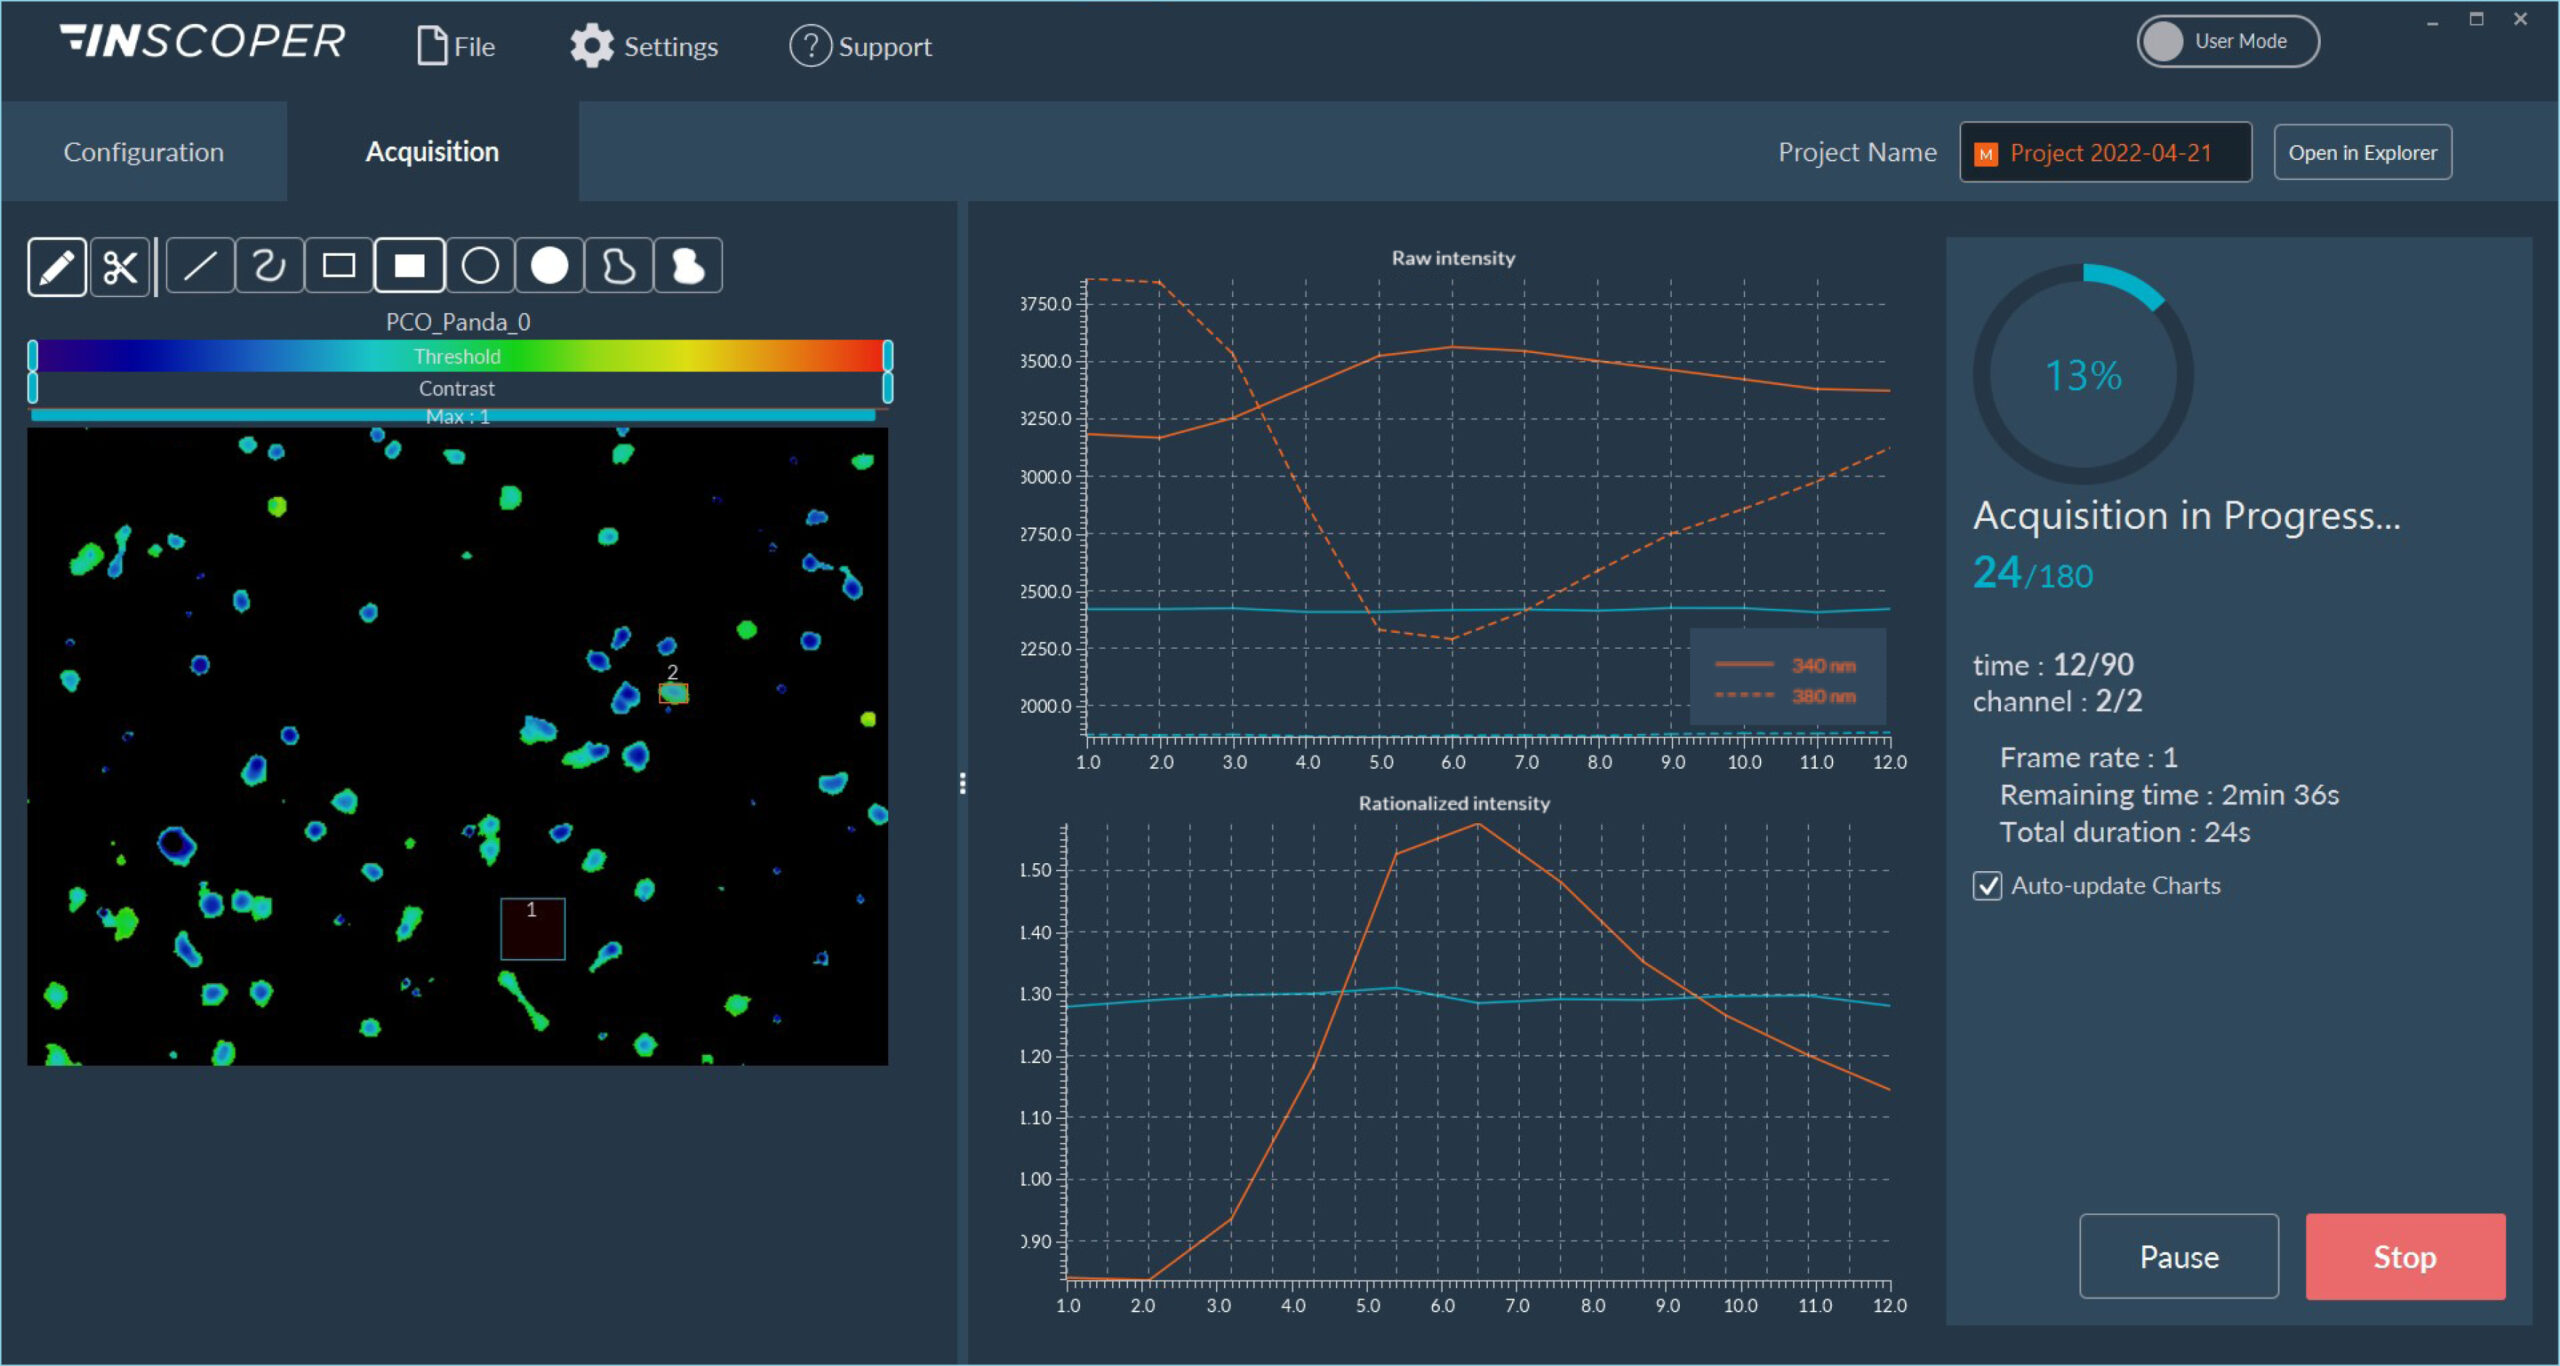
Inscoper liveRATIO is a complete microscopy solution for ratiometric imaging. The product consists of a software and hardware package compatible with advanced video microscopes used in life science (Figure 1).

Figure 1: Interface of the Inscoper software
Overview of the Inscoper user interface used to visualize the acquisition sequence. Here, cells were labeled with Fura-2. Images can be observed using a LUT dedicated to ratiometric imaging. A large panel of forms is available to select ROIs (Regions Of Interests). These areas will be used to monitor the evolution of the raw and rationalized fluorescence signal. All generated data can be exported in .tif for images, .csv for graphics and .avi for videos. Metadata is linked to each image.
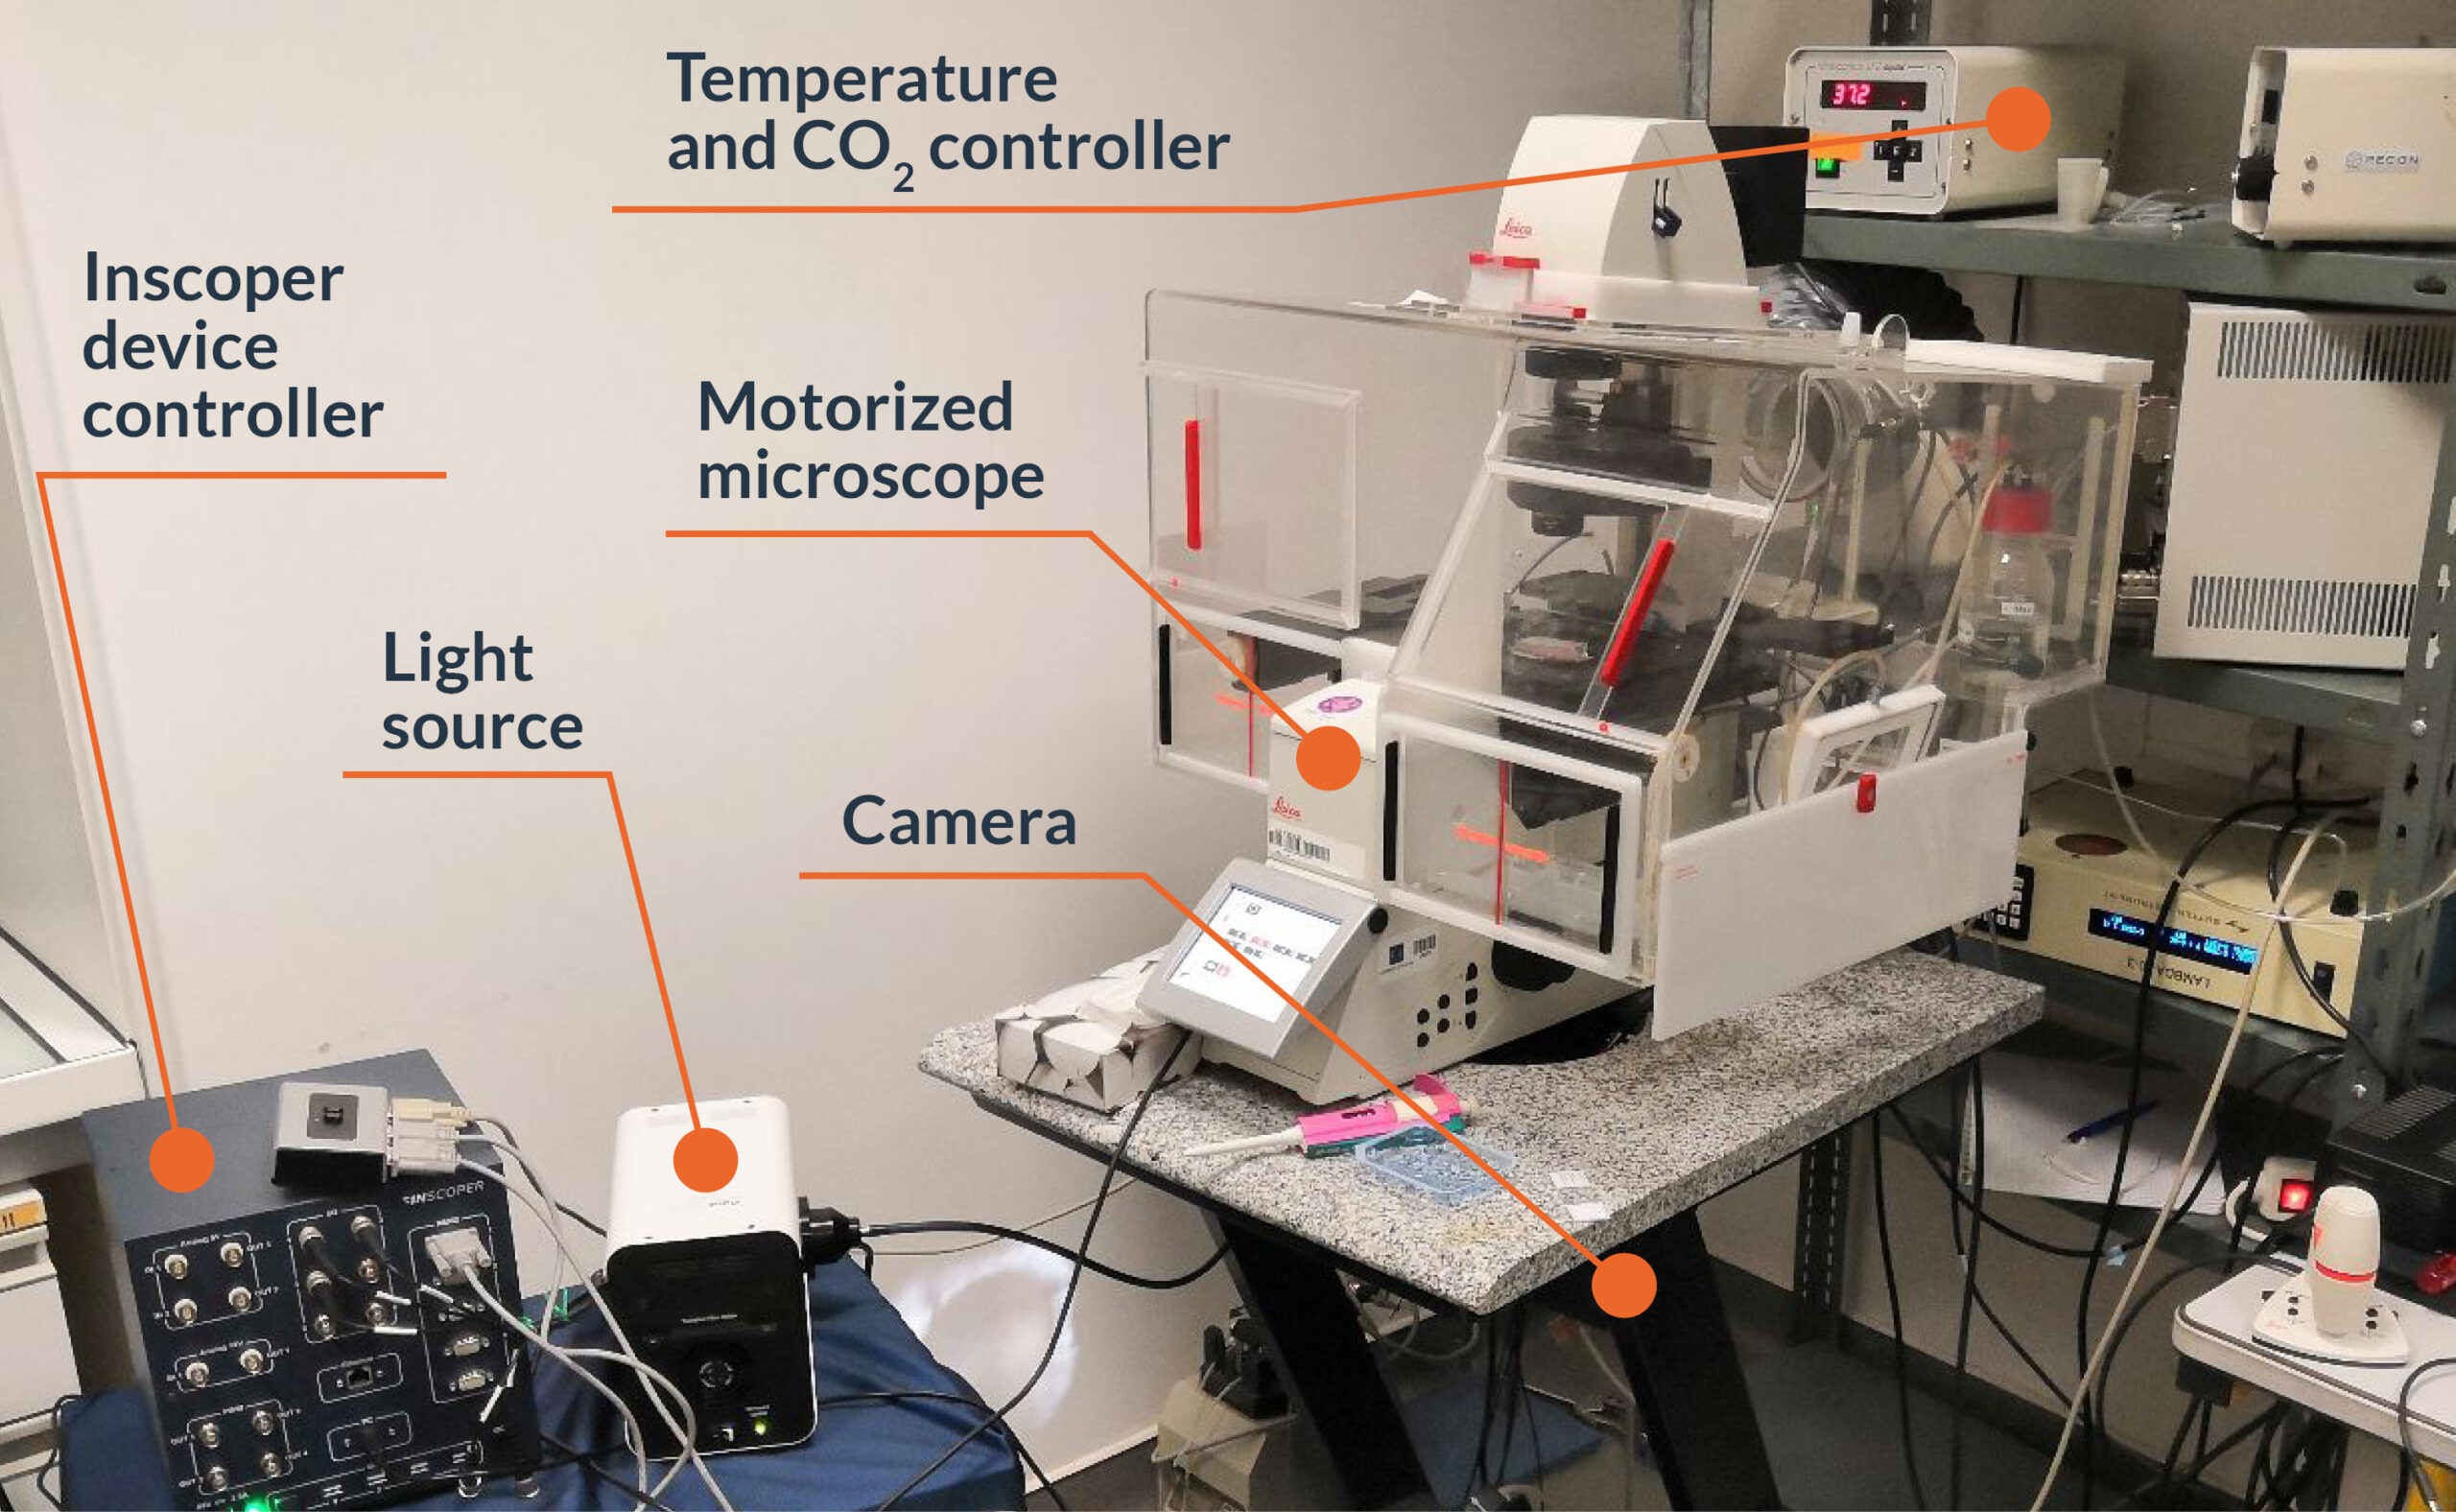
Incorporating a specially-designed electronic unit to control the microscope stand and third-party devices, the Inscoper liveRATIO provides a new user experience for ratiometric applications with improved technical performance, full system integration, and ease of use. The core of Inscoper technology eliminates any software latency when controlling the overall microscopy system. Compared to conventional approaches, it increases the temporal resolution which is a major advantage for applications in live cell imaging. Besides controlling the different motorized elements of the system, the Inscoper liveRATIO offers researchers an elegant and full-featured graphical interface to monitor the evolution of the fluorescence signals in their biological samples thanks to real time image processing (Figure 2). Inscoper liveRATIO is the new state-of-the-art solution for FRET experiments and ratiometric imaging (ions concentration monitoring, intracellular pH measurement, …) using fluorescent probes.

Figure 2: Experimental setup for calcium ratiometric imaging equipped with Inscoper liveRATIO
RATIOMETRIC IMAGING OF CALCIUM TRANSIENTS
Objectives
Here, we want to characterize the activation of γδ T cells following phosphoantigen presentation. For that, we will monitor the calcium transients in lymphocytes.
Material
This experiment was realized in collaboration with the microscopy facility MicroPICell (Nantes, France). A Leica DMI 6000B microscope (Leica, Wetzlar, Germany) with HC Plan Apo 20x 0.70 NA (506166; Leica) was used (Figure 2). For this experiment, the camera was a digital CMOS Orca Flash 4.0 (C11440; Hamamatsu Photonics, Hamamatsu, Japan) and the light engine was from CoolLED (pE-800fura; CoolLED, Andover, UK). Microscope control, acquisitions and live image processing were performed with Inscoper liveRATIO (INSCOPER, Cesson-Sévigné, France).
Method
γδ T cells were labeled with Fura-2 AM (F1201; Thermofisher, Waktham, MA, USA), a fluorescent probe with a high affinity to free intracellular calcium. Its spectral properties in the presence of low calcium concentrations (excitation max = 362 nm, emission max = 512 nm) differ from those during high calcium conditions (excitation max = 335 nm, emission max = 505 nm). Excitation at 340nm and 380nm can respectively image with calcium bound and free fluorescent probes. During acquisition, phospho-antigens were manually added in the medium of lymphocytes, and fluorescence was monitored. The same experiment has also been performed using DMSO (used for Fura-2 dilution), as a negative control.
Results
Many dyes are used to perform calcium imaging according to their properties (ability to bind calcium or to passively diffuse across plasma membrane, excitation/emission wavelengths, intensity, brightness, and stability). Moreover, imaging could be performed using non-ratiometric (more convenient and faster, but not suited for quantification) or ratiometric methods (more complicated but fully adapted for quantitative measurements).
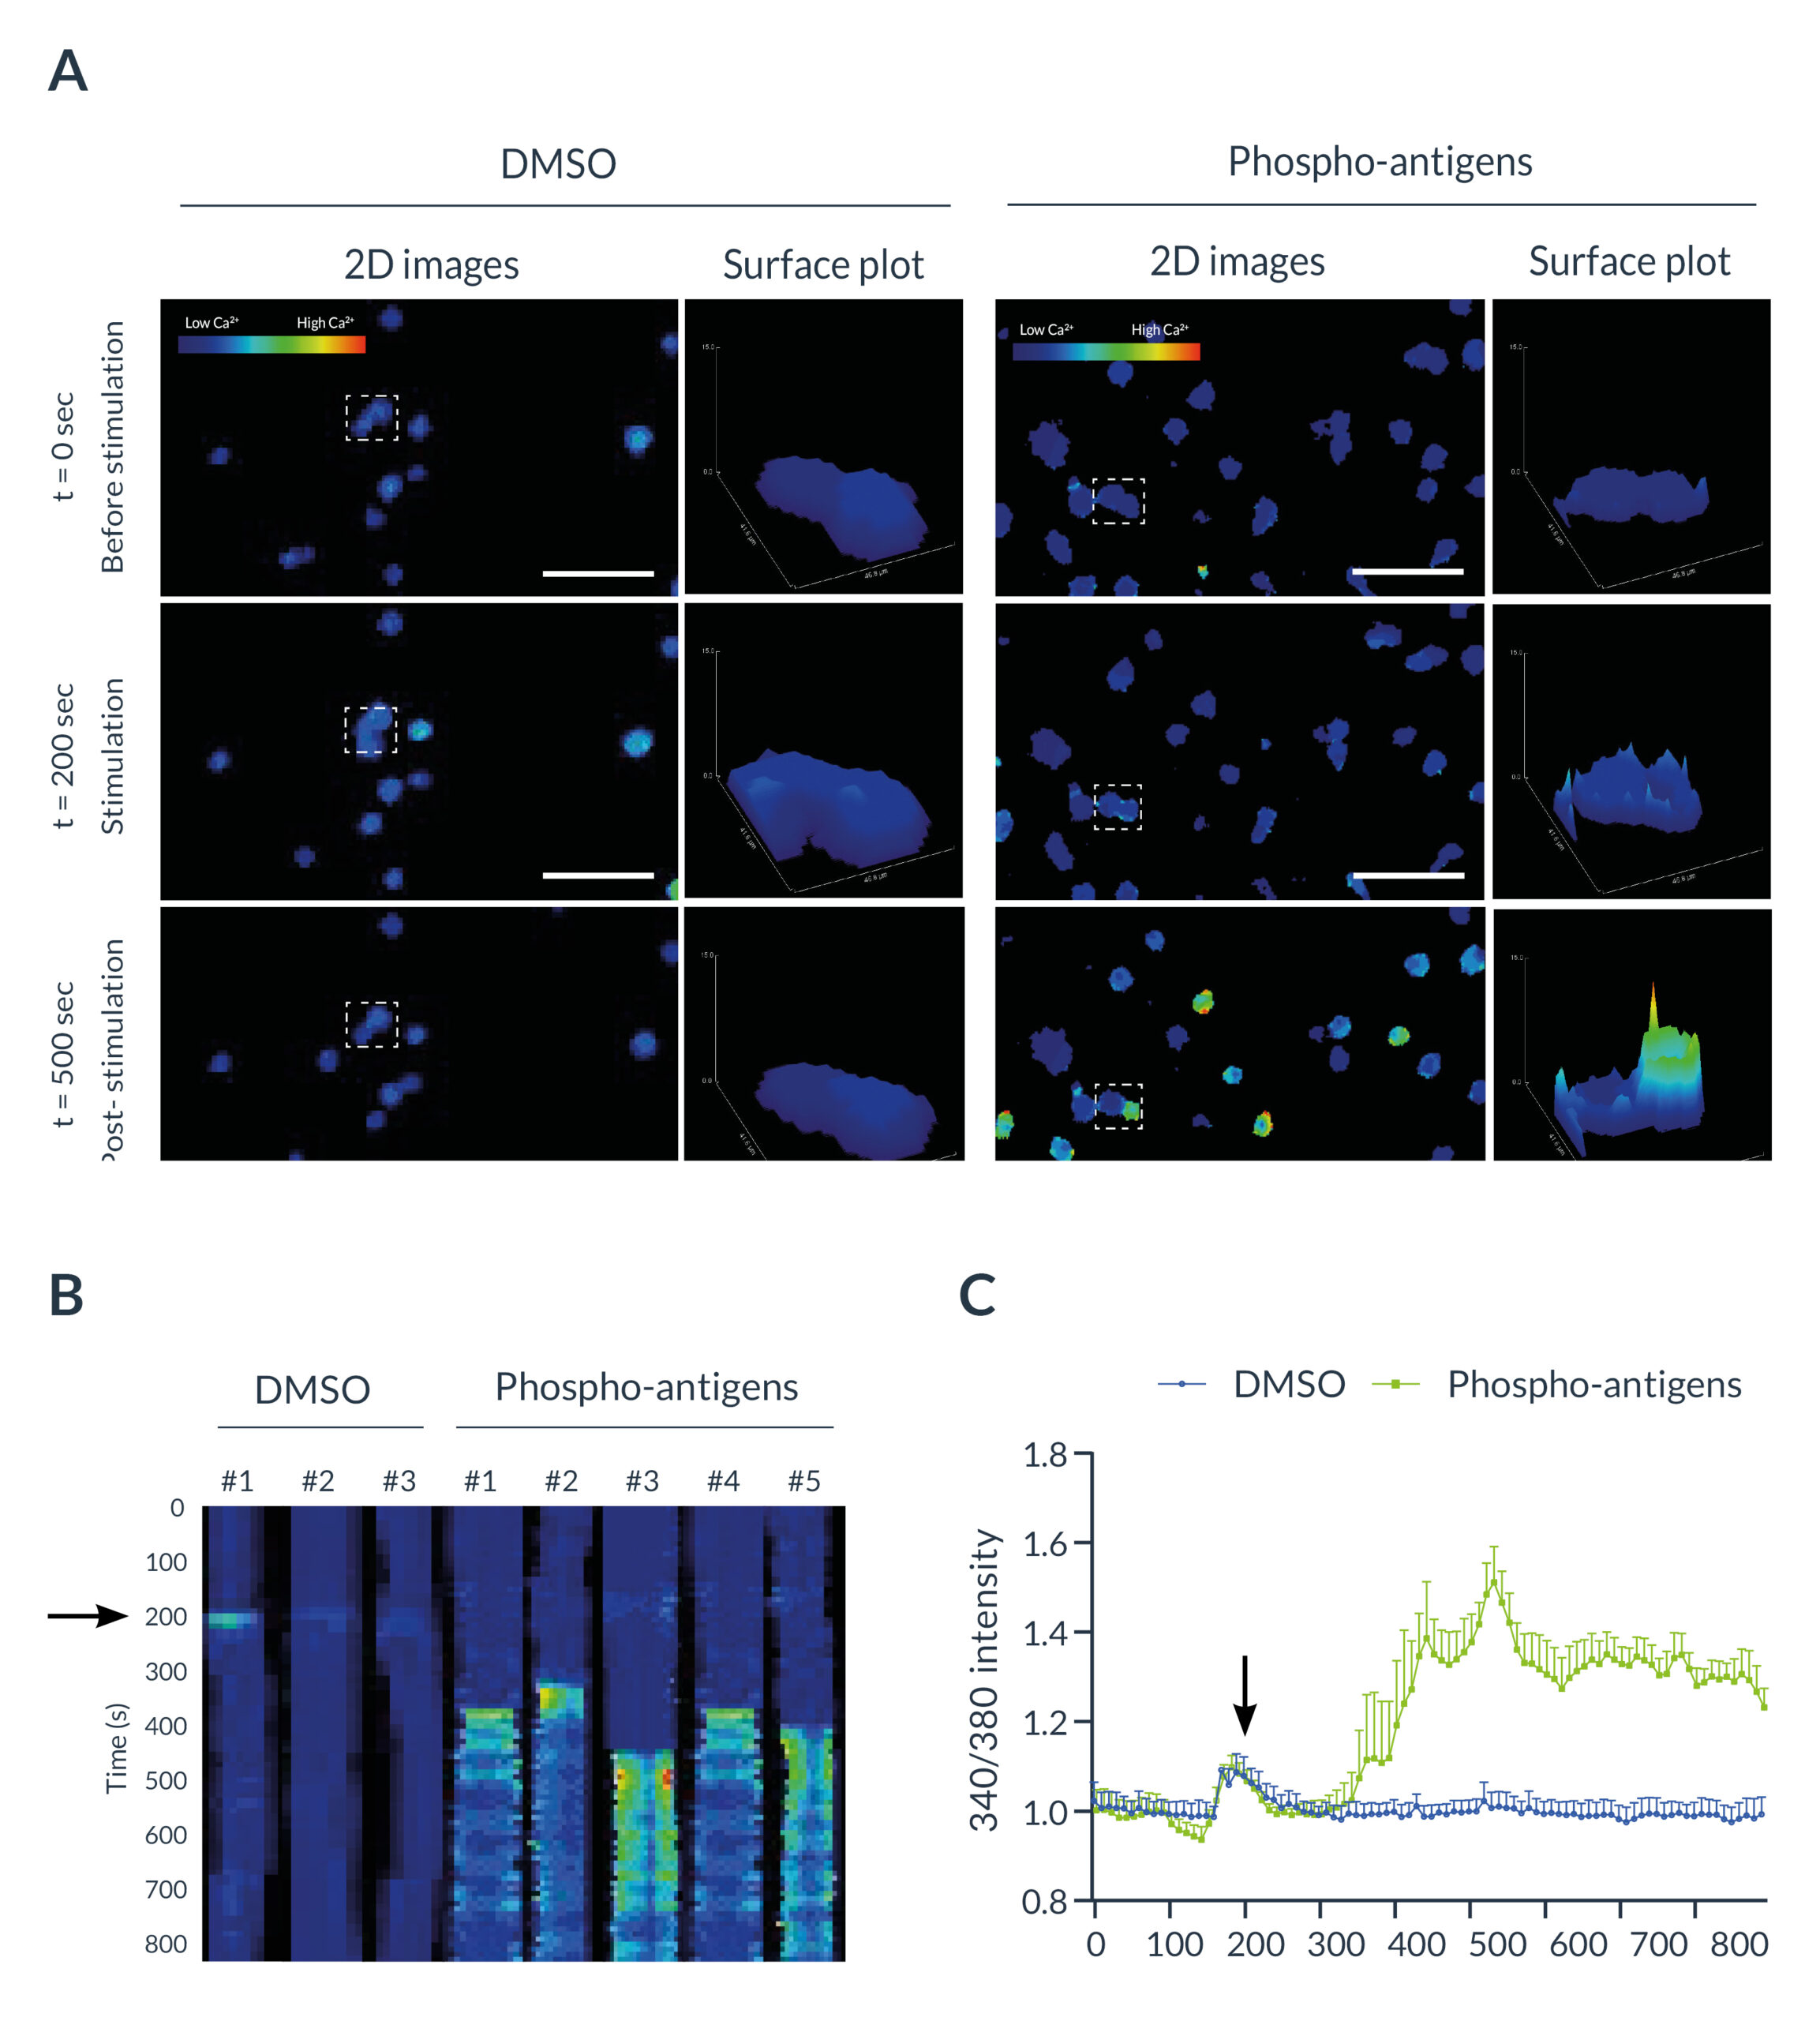
Fura-2 AM was preferred in this experiment due to (i) its ratiometric properties and (ii) its ability to diffuse across plasma membranes. Briefly, Fura-2 AM needs to be excited sequentially with two different wavelengths: 340 (with bound calcium) and 380 nm (free) with only one emission at 510 nm. Both signals are rationalized for quantification. Under basal conditions, intracellular calcium concentration remained low in all resting lymphocytes. When DMSO or phospho-antigens (PA) was added to the cell medium, a slight and transient increase of the ratio 340/380 was observed. No changes in the 340/380 ratio were observed in DMSO-treated T cells in the whole experiment. However, PA-treated lymphocytes rapidly exhibited an increase of this ratio as shown on 2D images, surface plots (Figure 3A), or on kymographs (Figure 3B). Measurement of the 340/380 signal revealed a 32.71 ± 0.07 % increase of the ratio in PA-treated cells, despite the ratio remaining stable in DMSO-treated cells (Figure 3C). These findings validated the activation of γδ T cells following PA stimulation.
Figure 3: T cells activation monitored by ratiometric imaging with the Inscoper liveRATIO
(A) Representative images of γδ T cells labeled with Fura-2 with DMSO or phospho-antigen (PA) stimulation. Surfaces plots are extracted from each dashed square. Scale bar = 100µm. (B) Kymograph representing the evolution of the fluorescence intensity as a function of time. The black arrowhead represents the addition of DMSO or PA in the medium. (C) Calcium fluctuation induced by DMSO or phospho-antigen on γδ T lymphocytes labeled with Fura-2. The black arrowhead represents the addition of DMSO or PA in the medium. Data are expressed according to the mean ± SEM.
Summary
Inscoper liveRATIO offers biologists and videomicroscope users the opportunity to characterize the activation of Fura 2-labeled immune cells following stimulation. This solution is a perfect tool for ratiometric (ion concentrations, pH measurement) and FRET (protein-protein interactions) imaging on a wide range of biological samples. Real time processing allows the observation of all dynamic modifications that can occur during imaging sessions with an optimized spatiotemporal resolution. More than acquisition and processing software, the Inscoper liveRATIO can control all devices of the microscopy system to combine multidimensional and complex acquisitions, including temperature and CO2 settings of an incubator chamber or syringe pumps for microfluidic experiments. The next improvement for ratiometric imaging applications would be to perform cell tracking in order to monitor fluorescence in real time, without being affected by cell mobility.
ACKNOWLEDGEMENTS
We acknowledge the IBISA MicroPICell facility (Biogenouest), a member of the national infrastructure France-Bioimaging supported by the French National Research Agency (ANR-10-INBS-04). We particularly thank Philippe Hulin and Steven Nedellec for their technical, methodological, and scientific support. We also thank Chirine Rafia and Marie Giraud (CRCI2NA, Nantes, France) for the cell preparation and labeling.
Bibliography
- Balagopalan L, Sherman E, Barr VA & Samelson LE (2011) Imaging techniques for assaying lymphocyte activation in action. Nat Rev Immunol 11: 21–33
- Berridge MJ, Bootman MD & Roderick HL (2003) Calcium signalling: dynamics, homeostasis, and remodelling. Nat Rev Mol Cell Biol 4: 517–529
- Berridge MJ, Lipp P & Bootman MD (2000) The versatility and universality of calcium signalling. Nat Rev Mol Cell Biol 1: 11–21
- Clapham DE (2007) Calcium Signaling. Cell 131: 1047–1058
- Grienberger C & Konnerth A (2012) Imaging Calcium in Neurons. Neuron 73: 862–885
- Humeau J, Bravo-San Pedro JM, Vitale I, Nuñez L, Villalobos C, Kroemer G & Senovilla L (2018) Calcium signaling and cell cycle: Progression or death. Cell Calcium 70: 3–15
- Paemeleire K, Martin PEM, Coleman SL, Fogarty KE, Carrington WA, Leybaert L, Tuft RA, Evans WH & Sanderson MJ (2000) Intercellular Calcium Waves in HeLa Cells Expressing GFP-labeled Connexin 43, 32, or 26. Mol Biol Cell 11: 1815–1827
- Vig M & Kinet J-P (2009) Calcium signaling in immune cells. Nat Immunol 10: 21–27
- Zumerle S, Calì B, Munari F, Angioni R, Di Virgilio F, Molon B & Viola A (2019) Intercellular Calcium Signaling Induced by ATP Potentiates Macrophage Phagocytosis. Cell Rep 27: 1-10

0 Comments