Continuous motion imaging – Gaithersburg, Maryland, USA

Continuous motion imaging – Gaithersburg, Maryland, USA

System description & applications

This system is used to perform continuous motion imaging of large samples on multi-well plate supports at a very high frame rate. 

INSCOPER has replaced some of the existing system’s devices and integrating a dedicated sub-system (or module) for continuous motion imaging. Our engineers have also updated and automated the Zeiss Axio Observer Z1 microscope system to perform the continuous motion imaging workflow.

The system is installed at the National Institute of Standards and Technology (NIST; Gaithersburg, Maryland, USA).


microscope device list


  • Microscope: Zeiss Axio Observer Z1
  • LED source for short illumination bursts:
    • Märzhäuser LED 100
    • Märzhäuser DSU-1 controller unit for LED 100
  • Cameras:
    • 2x Hamamatsu Fusion BT
  • LED source for fluorescence excitation
    • Fluorescence Illumination System CoolLed pE-4000
  • x-y scanning stage and piezo stage:
    • Märzhäuser SCANplus IM 130 × 100
    • Controller Tango 2 
fastFLIM & FRAP – Rennes, France

fastFLIM & FRAP – Rennes, France

System description & applications

Combining the Inscoper fastFLIM with Inscoper’s scanFRAP photomanipulation solution the system serves multiple biologists with different levels of microscopy practice.

The system is mainly used for rapid imaging of biosensors expressed by transfected live cells. The combination of FLIM and FRAP modalities in the same acquisition allows to interact with living cells to analyze a wide variety of biological processes such as protein expression, nuclear protein recruitment or mitosis.


microscope device list


  • Microscope Leica DMI6000B
  • Stage Marzhauser
  • Intensifier HRI Kentech
  • Delay generator Kentech
  • Spinning disk Yokogawa
  • Filter wheel Sutter Lambda 10-3
  • Shutter Lambda SC
  • Wavelength selector PI
  • Inscoper scanFRAP imaging solution
  • Camera Coolsnap HQ2 Photometrics
  • Optical component Optotune
Characterization of organelle dynamics in living cells by combining Oxxius lasers and Inscoper scanFRAP

Characterization of organelle dynamics in living cells by combining Oxxius lasers and Inscoper scanFRAP

Fluorescence Recovery After Photobleaching (FRAP) is nowadays considered as the mode widely used method to monitor protein and organelle dynamics. This application note introduces the use of the Inscoper scanFRAP solution to explore the cinetic of endoplasmic reticulum in live cells.

FRAP experiment on HeLa cells.

Biological context

The endoplasmic reticulum (ER) is a membrane-bound organelle found throughout the cytoplasm of all eukaryotic cells. The ER plays a central role in many biological processes, including protein synthesis, glucose-lipid metabolism, signaling, and calcium dynamics (Öztürk et al, 2020). This abundant structure is formed and maintained by a permanent remodeling process that involves the synthesis, transport, and fusion with pre-existing ER tubules. Dysfunction of the ER could induce severe diseases such as neurodegenerative disease, cancer, or metabolic diseases (Ozcan & Tabas, 2012; Roussel et al, 2013; Oakes, 2020). Thus, the live imaging of the ER dynamics became a gold standard technique in order to better understand the pathophysiological pathways involved.

FRAP technique for live cell imaging

In live cell imaging, biologists commonly use fluorescent markers to track organelles and/or proteins. However, these fluorophores can permanently lose their ability to emit fluorescence when the excitation light is very intense or the exposure time is too long. This irreversible phenomenon is called photobleaching. Such signal loss is a real problem in most imaging experiments, except for some techniques that take advantage of this alteration like FRAP (Fluorescence Recovery After Photobleaching). In the 1970s, FRAP experiments emerged as a new tool for the study of fluorescent protein mobility and dynamics in living cells (Axelrod et al, 1976). Nowadays, it has become a common technique for studying dynamics in almost all aspects of cell biology such as cytoskeleton dynamics (Appaduray et al, 2016), intracellular vesicle transport (Tagawa et al, 2005), cell adhesion (von Wichert, 2003), mitosis (Raccaud et al, 2019) or signal transduction (Giese et al, 2003). Briefly, fluorescent molecules are irreversibly photobleached in regions of interest (ROI) of the cell (cytoplasm, membrane, …) by a high-powered focused laser beam, removing all fluorescent signals (Figure 1A). Subsequent diffusion of surrounding non-bleached fluorescent molecules into the bleached area leads to a recovery of fluorescence (Kang et al, 2010; Lippincott-Schwartz et al, 2018).

fig1_principle of FRAP imaging

Figure 1. Principle of FRAP imaging
(A) Before the laser-induced photobleaching, the fluorescent proteins are uniformly distributed in a membrane. Immediately after photobleaching, all probes located in the regions of interest (ROI) are not able to emit fluorescence anymore. Return of fluorescence is only due to the exchange of non-fluorescent with fluorescent proteins by lateral diffusion within the membrane. (B) Schematic curve highlighting the fluorescence recovery in time following photobleaching. The immobile fraction is the difference observed between the initial and the final fluorescence intensity. It represents the part of fluorescent protein that is not able to move inside the biological sample observed. The halftime recovery corresponds to the time needed to reach 50% of the final fluorescence intensity (t1/2) following bleaching (t0).

Some parameters can be measured to characterize the dynamics of these fluorescent proteins. One of them is the halftime of recovery (t1/2) which corresponds to the time from the bleach (t0) to the timepoint where the fluorescence intensity reached half of the final recovered intensity (t1/2). The shorter the half-time, the faster the fluorescence recovery occurs and the higher the diffusion. The mobility of fluorescent proteins can also be estimated according to the profile of the intensity recovery curve (Ishikawa-Ankerhold et al, 2012). Mobile and immobile fractions can be measured by calculating the ratios of the final to initial fluorescence intensity (Figure 1B).

To perform FRAP experiments, it is necessary to note that the system has to be adapted to each experiment. For instance, fluorescence recovery could be very fast and needs imaging systems with high frame-rate to improve the temporal resolution of the experiment. Laser control is another key parameter for researchers to adapt, personalize and optimize their ROI selection.

Oxxius lasers for photomanipulation experiments

INSCOPER (Cesson-Sévigné, France) has been working for several years with the laser source designer and manufacturer Oxxius (Lannion, France). This company developed advanced continuous-wave laser modules to target a wide spectrum of applications in biophotonics, spectroscopy, metrology, etc.  Oxxius commercializes the L4Cc and L6Cc combiners that are the most compact all-in-one multicolor laser source that could include respectively up to 4 or 6 wavelengths delivered on up to 4 distinct optical fibers outputs. Each laser can be modulated by analog and digital inputs. These controllers can provide a large panel of wavelengths from 375 to 1064nm. Extension modules improve the flexibility of the combiner,  by integrating fast switching output ports for FRAP, and adjustable split power for light sheet microscopy among other advanced functionalities.

Inscoper Solution for FRAP imaging

Based on galvanometric mirror technology, the Inscoper scanFRAP is a complete microscopy solution for photomanipulation and optogenetics experiments. The product consists of a software and hardware package compatible with advanced video microscopes used in life science. Incorporating a specially-designed electronic unit to control the microscope stand and third-party devices, the Inscoper scanFRAP provides a new user experience for photomanipulation applications with improved technical performance, full system integration, and ease of use. The core of Inscoper technology eliminates any software latency when controlling the overall microscopy system. It increases the temporal resolution, compared to conventional approaches, which is a major advantage for applications in live cell imaging (Figure 2). Researchers have full control of all laser settings (power, points density, pulse time). They can completely personalize and optimize the bleached areas, modulating the region of interest (ROI) in the software user interface.

Inscoper scanFRAP interface

Figure 2: Interface of the Inscoper software
Overview of the Inscoper software used to manage the acquisition sequence with multidimensional parameters including timelapse, multiposition, multi-channels, and photomanipulation. All of these dimensions are fully customizable to be more suitable for the user’s experiments.

FRAP experiments

Objectives

Here, we want to characterize the dynamic of the endoplasmic reticulum in living cells using a FRAP approach.

Material 

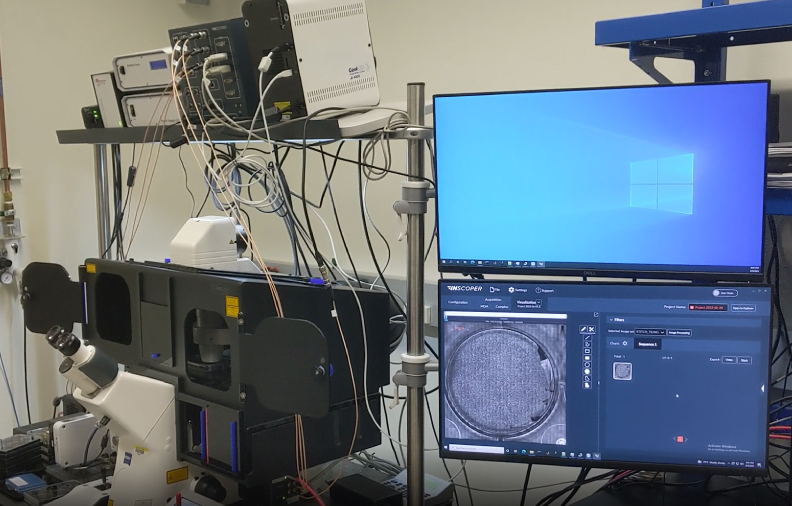
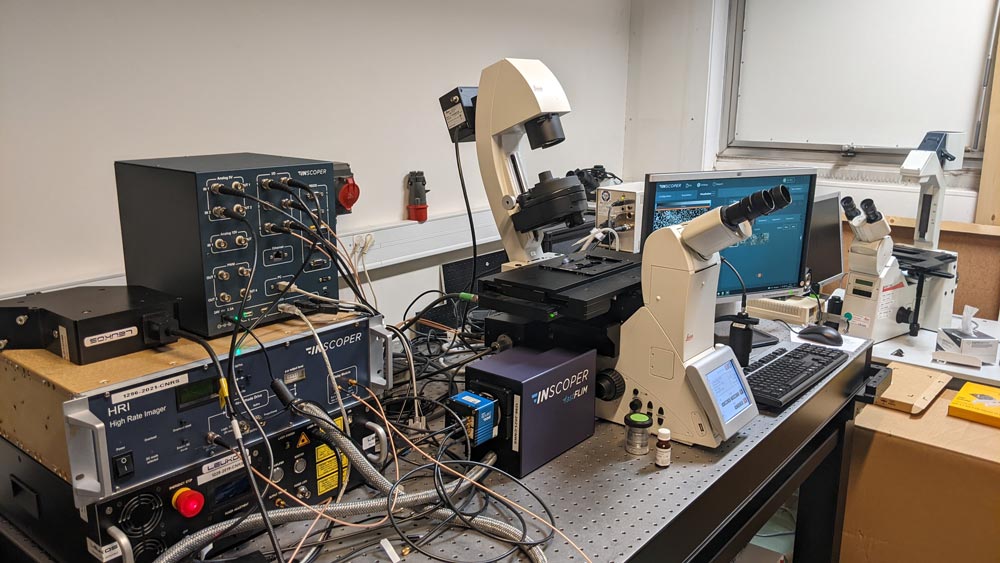
A Nikon Ti2 Eclipse microscope (Nikon, Tokyo, Japan) with a Plan Apo λ 60x 1.4 NA oil immersion objective (MRD01605; Nikon) was used. For this experiment, the camera was a digital CMOS ORCA-Fusion BT (C15440-20UP; Hamamatsu Photonics, Hamamatsu, Japan) and the light engine was from CoolLED (pE-800fura; CoolLED, Andover, United Kingdom). Videomicroscopy and FRAP were performed using Inscoper scanFRAP (INSCOPER, Cesson-Sévigné, France) with a 405nm laser source (L6Cc; Oxxius, Lannion, France).  All images were deconvolved using Microvolution software (Microvolution, Cupertino, CA, USA).

Method

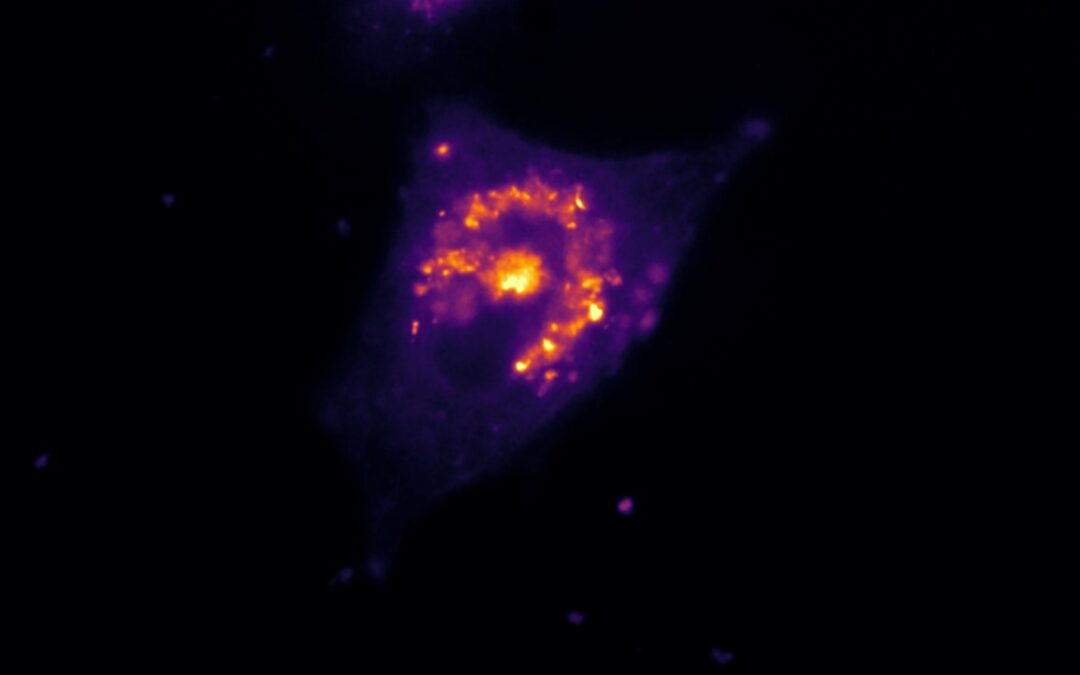
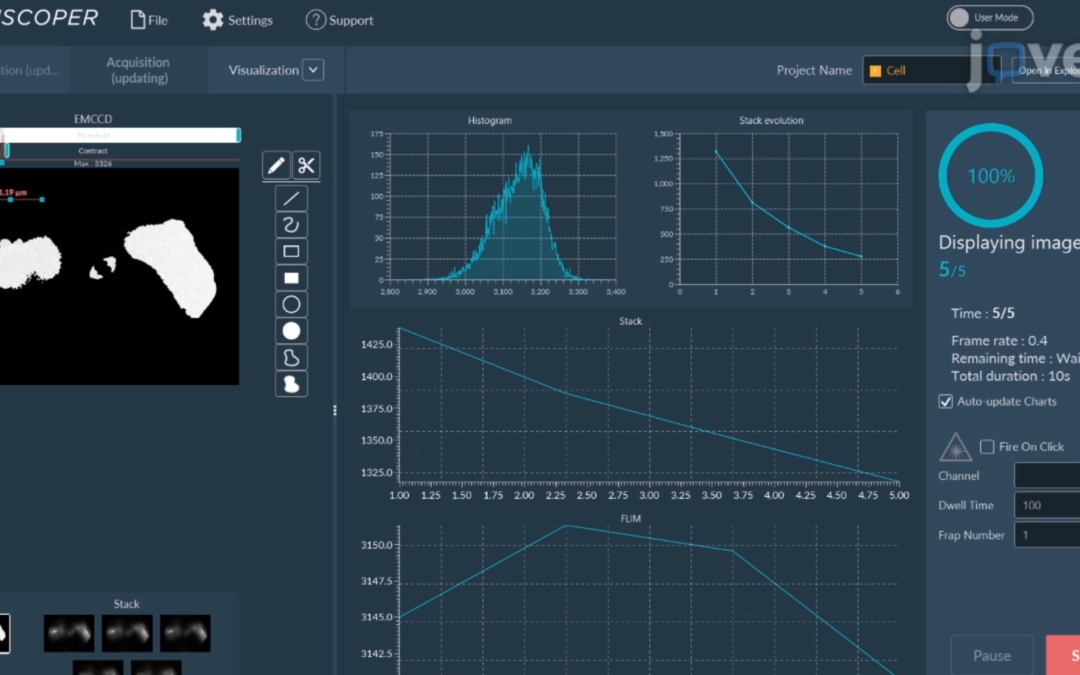
HeLa cells were transfected to overexpress YFP (Yellow Fluorescent Protein) in their endoplasmic reticulum. For the FRAP experiment, ROI was defined and bleached using the 405nm laser on living cells and fixed cells as negative control. The fluorescence recovery was then measured. FRAP experiments are basically composed of three steps. First, a short pre-bleached timelapse is captured to get basal levels of fluorescence. Here, a stable and strong YFP signal was observed in transfected cells before photomanipulation. Then, the region of interest (ROI) is selected and photobleached with the appropriate laser settings (wavelength, intensity, point density, …). Finally, another timelapse is performed to monitor in real-time the fluorescence recovery in the bleached ROI.

Results

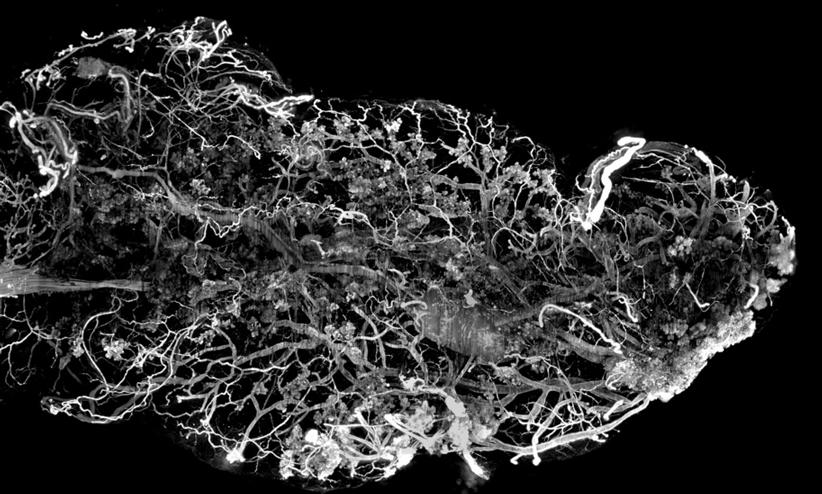
The laser microirradiation represents a powerful tool to monitor DNA repair with high temporal and spatial resolution. DNA lesions were induced following ROI (region of interest) previously defined using the Inscoper software. During the acquisitions, a progressive recruitment of ALC1-GFP protein could be observed over the entire length of the ROI (Figure 3A). Mean intensity of the fluorescent signal has been then measured on the damaged area. The signal from an unaltered ROI was also measured as control. A rapid increase of the signal was observed in the irradiated area, to remain stable in less than 10 seconds (Figure 3B). On the contrary, intensity from the control ROI appeared slightly decreased following the photomanipulation. ALC1-GFP accumulation could also be characterized by the width of the band (Figure 3C). In this experiment, the phenomenon was rapid with a half time of 47.7 ± 7.1 seconds and total recovery in just over 300 seconds (Figure 3D). YFP-labeled proteins from the ER in living cells appeared to be mobile and able to rapidly diffuse inside the cell cytoplasm.

Figure 3: FRAP experiment to monitor the endoplasmic reticulum dynamics in living cells
(A) Representative example of HeLa cells expressing YFP-ER before and after photobleaching. The recovery of the fluorescent signal after photobleaching within the region marked by the dashed rectangle is visualized over time. This area is zoomed in at the bottom right corner of each image. The represented dashed line indicates the area used for the following kymograph. (B) Kymograph representing the evolution of the fluorescence intensity as a function of time. The black arrowhead represents the photobleaching event. (C) Normalized quantification of the fluorescence recovery following a photobleaching event (n = 7). Data are expressed according to the mean ± SEM. (D) Half-time of the fluorescence recovery in FRAP assays (n = 7).

It is important to note that the FRAP approach is not the only technique available to characterize ER dynamics. It can also be monitored by videomicroscopy (Figure 4). Here, ER tubule was imaged, providing users the ability to measure its movement and remodeling. This information is complementary to those previously generated with FRAP, giving information about the formation, fusion/fission of these complex organelles.

Figure 4: Monitoring of endoplasmic reticulum tubule dynamics
Widefield fluorescence imaging of HeLa cells transfected with YFP-ER. The dashed rectangle is zoomed in on the right part of the figure. The elongation of the ER tubule is marked with the arrowhead in the images. Scale bar = 10µm.

Summary

FRAP experiments using the Inscoper scanFRAP offer biologists and microscope users the opportunity to characterize in real-time the kinetics of fluorescence-labeled proteins, combining photomanipulation and videomicroscopy with high spatiotemporal resolution. The scanFRAP stands out from the other products by its customizable features and its smooth integration into a versatile and user-friendly image acquisition software solution. Combined with Oxxius lasers, it is the perfect solution to investigate protein movement/diffusion, compartmentalization, and connections between intracellular compartments, the speed of protein exchange between compartments, and the binding characteristics between proteins. It is worth noting that the Inscoper scanFRAP can be combined with other advanced light imaging techniques (FLIM, FRET), or with various illumination modalities (spinning disk, TIRF, HiLo, light-sheet…) to have a complementary approach.


Bibliography

    1. Appaduray MA, Masedunskas A, Bryce NS, Lucas CA, Warren SC, Timpson P, Stear JH, Gunning PW & Hardeman EC (2016) Recruitment Kinetics of Tropomyosin Tpm3.1 to Actin Filament Bundles in the Cytoskeleton Is Independent of Actin Filament Kinetics. PLOS One 11: 1–16
    2. Axelrod D, Koppel DE, Schlessinger J, Elson E & Webb WW (1976) Mobility measurement by analysis of fluorescence photobleaching recovery kinetics. Biophys J 16: 1055–1069
    3. Giese B, Au-Yeung C-K, Herrmann A, Diefenbach S, Haan C, Küster A, Wortmann SB, Roderburg C, Heinrich PC, Behrmann I, et al (2003) Long Term Association of the Cytokine Receptor gp130 and the Janus Kinase Jak1 Revealed by FRAP Analysis. J Biol Chem 278: 39205–39213
    4. Ishikawa-Ankerhold HC, Ankerhold R & Drummen GPC (2012) Advanced Fluorescence Microscopy Techniques—FRAP, FLIP, FLAP, FRET and FLIM. Molecules 17: 4047–4132
    5. Kang M, Day CA, DiBenedetto E & Kenworthy AK (2010) A Quantitative Approach to Analyze Binding Diffusion Kinetics by Confocal FRAP. Biophys J 99: 2737–2747
    6. Lippincott-Schwartz J, Snapp EL & Phair RD (2018) The Development and Enhancement of FRAP as a Key Tool for Investigating Protein Dynamics. Biophys J 115: 1146–1155
    7. Oakes SA (2020) Endoplasmic Reticulum Stress Signaling in Cancer Cells. Am J Pathol 190: 934–946
    8. Ozcan L & Tabas I (2012) Role of Endoplasmic Reticulum Stress in Metabolic Disease and Other Disorders. Annu Rev Med 63: 317–328
    9. Öztürk Z, O’Kane CJ & Pérez-Moreno JJ (2020) Axonal Endoplasmic Reticulum Dynamics and Its Roles in Neurodegeneration. Front Neurosci 14: 1–33
    10. Raccaud M, Friman ET, Alber AB, Agarwal H, Deluz C, Kuhn T, Gebhardt JCM & Suter DM (2019) Mitotic chromosome binding predicts transcription factor properties in interphase. Nat Commun 10: 1–16
    11. Roussel BD, Kruppa AJ, Miranda E, Crowther DC, Lomas DA & Marciniak SJ (2013) Endoplasmic reticulum dysfunction in neurological disease. Lancet Neurol 12: 105–118
    12. Tagawa A, Mezzacasa A, Hayer A, Longatti A, Pelkmans L & Helenius A (2005) Assembly and trafficking of caveolar domains in the cell. J Cell Biol 170: 769–779
    13. von Wichert G (2003) Force-dependent integrin-cytoskeleton linkage formation requires downregulation of focal complex dynamics by Shp2. EMBO J 22: 5023–5035
Imaging cleared organ with an Ultramacroscope using Inscoper Imaging Solution

Imaging cleared organ with an Ultramacroscope using Inscoper Imaging Solution

Light-sheet fluorescence microscopy is an illumination technique well-suited for volumetric imaging that can be used for a wide spectrum of biological applications. Here, we present an opportunity for researchers to upgrade their macroscope to an “ultramacroscope”, a versatile instrument based on light-sheet illumination. This innovative technology was developed by Dr. Frédéric Brau from the MICA facility (Microscopy Imagerie Côte d’Azur) and Institute for Molecular and Cellular Pharmacology (IPMC) in collaboration with P. Girard and N. Mauclert from the Mechanical conception and realization workshop of the Observatoire de la Côte d’Azur (France) ; with the financial support of the GIS IBiSA (ITMO Cancer Plan Cancer 2009-2013). It is now integrated with the Inscoper Imaging Solution to optimize the acquisition sequences and facilitate their use by biologists.

ADVANTAGES OF LIGHT-SHEET FLUORESCENCE MICROSCOPY FOR 3D IMAGING

Tissues are composed of multiple polarized cell types organized in well-defined three-dimensional architecture. Imaging of large samples has become an essential technique to characterize biological processes (such as physiological or pathological development of tissues/organs) and anatomical structures (vascularisation, innervation, …). The main difficulties of large specimen imaging are the heterogeneity of refractive index and composition of tissues, that limit the spatial resolution and the imaging depth (Wang et al, 2014). However, a large variety of clearing techniques have been developed to circumvent these issues (Richardson & Lichtman, 2015).

Discovered in 1902, the use of planar illumination in microscopy was then combined with fluorescence microscopy for biological applications (Siedentopf & Zsigmondy, 1902; Voie et al, 1993). The laser beam laterally illuminates the sample with a thin sheet of illumination at the focal plane and emitted fluorescence is then collected perpendicularly by a camera.

Light-sheet fluorescence microscopy (LSFM) is nowadays the ideal technique for cleared sample imaging (Huisken et al, 2004). It has several advantages compared to conventional optical sectioning microscopy approaches. It is a camera-based system providing a better sensitivity for the detection of photons. This approach also provides a greater acquisition speed due to the absence of scanning, limiting phototoxicity. Thus, LSFM provides researchers with a powerful approach to image fluorescence (endogenous or immunolabeled) of a wide range of biological samples, from organoids to cleared organs or whole-body mice.

UPGRADE A MACROSCOPE TO AN ULTRAMACROSCOPE

Frédéric Brau’s team (Institute for Molecular and Cellular Pharmacology [IPMC]; Nice, France) has recently developed an open and versatile light-sheet illumination module that can easily be implemented on commercial macroscopes (Leica, Nikon, Olympus, Zeiss). This system consists of a plug-and-play cylindrical-lens-based dual illumination unit (Figure 1). Here, the ultramacroscope used for this technical note was presented in a workshop during MiFoBio 2021 (Giens, France). It is based on a macroscope (MVX10; Olympus, Tokyo, Japan). Two illumination units are present and face each other, both of them are connected to the laser source (LBX-4C; Oxxius, Lannion, France) by an individual optical fiber. To prevent chromatic aberration, the beams pass through a double achromatic doublet (AC254-075-A-ML; Thorlabs, Newton, USA). The parallel beam is then projected onto a cylindrical doublet (ACY254-100-A, Thorlabs) through an iris diaphragm to induce the formation of two light sheets that are facing each other. Focalisation and co-alignment of the light sheets are done by the translation and the tilting of the illumination unit. A precise alignment of the sheets can be realized using a knife-edge prism (KRPB4-15-550; Optosigma Europe, Les Ulis, France). An orthogonal view of the 488nm and 561nm light sheets at different positions of the prism indicate the quality of the alignment. A sample holder is located at the intersection point of the beams and can be used to move the biological specimen vertically by a vertical translation stage (M-122.2DD; Physik Instrumente, Karlsruhe, Germany). The emitted fluorescent signal is collected through the 2X/0.5 objective, a filter wheel (Lambda 10-B; Sutter Instrument, Novato, CA, USA), and collected by an sCMOS camera (Flash4.0; Hamamatsu, Hamamatsu, Japan).

Fig1_Ultramacroscope-setup-equipped-with-Inscoper-Imaging-Solution

Figure 1: Ultramacroscope setup equipped with Inscoper Imaging Solution

This system was initially controlled with μManager software (http://www. micro-manager.org) and has been mentioned in several publications (Simon et al, 2017; Guyot et al, 2019a, 2019b). However, the lack of software ergonomics made the user experience tedious. The research team decided to change for the Inscoper Imaging Solution to have all devices integrated and controlled in a user-friendly environment. The images are generated in an open format compatible with the 3D visualization software and analysis workflow.

INSCOPER IMAGING SOLUTION FOR HOME-MADE IMAGING SYSTEMS

The Inscoper Imaging Solution is a full image acquisition solution for basic and advanced camera-based microscopes used in life science. It can be used on both commercial (Leica, Nikon, Olympus, and Zeiss) and home-made systems for the integration of a new device (camera, light source, spinning disk module, …) or a complete retrofit of the system. In all situations, the user-friendly graphical user interface allows the full control of all motorized devices, customizable calibration protocols, multidimensional acquisition (time, XYZ, channels, multi-positions, and tiling), and visualization. In addition to its universal and ergonomic aspect, the Inscoper technology improves the temporal resolution of acquisitions by removing all software latency and optimizing the synchronization of the elements of the microscope (Figure 2).

Fig2_Inscoper_Interface

Figure 2: User interface of the Inscoper software
Overview of the Inscoper user interface used to manage the multidimensional acquisitions on the home-made ultramacroscope including timelapse, Z-stack, and multi-channels. All of these dimensions are fully customizable to be more suitable for user’s experiments. The software also provides users with a dedicated calibration protocol to perform the co-alignment of both light sheets before imaging.

BIOLOGICAL APPLICATIONS

The ultramacroscope, equipped with the Inscoper Imaging Solution, was shown during the microscopy event MiFoBio 2021 (Giens, France)during a workshop entitled “Immunolabeling and tissue clearing, acquisitionwith home-made versus commercial system” animated by Sophie Abélanet (Institute for Molecular and Cellular Pharmacology [IPMC]; Nice, France) and Dr. Chloé Dominici (Institute for Research on Cancer and Aging [IRCAN], Nice, France).

The system was used to image an entire mammary gland from a mouse (dimensions: 1.5×0.5cm). This organ was prepared using the iDISCO+ clearing protocol. This protocol was chosen for its compatibility with immunolabeling, its simplicity, and its low cost (Renier et al, 2016). It was also immunolabeled with a primary antibody against SMA (Smooth Muscle Actin) and a secondary antibody coupled with an Alexa 568. The SMA protein labels the myoepithelial cells in the mammary gland. These differentiated cells form the basal layer of mammary ducts, apposed to the basement membrane. Myoepithelial cells have different roles, including contraction to expel glandular secretions (Gieniec & Davis, 2022). The labeling of this protein is often used to characterize the structure of the whole tissue and evaluate the effect of the pathological phenomenon.

The ultramacroscope succeeded to image the whole organ (Figure 3). Then, images generated by the Inscoper Imaging Solution were opened with the open-source ImageJ software (https://imageJ.nih.gov/ij/) for processing and with the commercial Imaris software (Bitplane, Belfast, United Kingdom) for 3D visualization of the sample.

Figure 3: Imaging of myoepithelial cells in cleared mammary gland using the ultramacroscope
Maximum projection image of an entire iDISCO-cleared mammary gland with myoepithelial cells labeling (SMA, red). Two dashed rectangles are zoomed in at the right part of the image. Dashed circles represent some clusters of alveoli and arrows point to ducts. Scale bar: 1mm (left) and 500µm (right).

Summary

The home-made microscopy work presented in this technical note has enabled an innovative and cost-effective upgrade of a pre-existing system into an ultramacroscope. INSCOPER provided a tailor-made solution to improve the user experience and microscope control. The Inscoper Imaging Solution guarantees a perfect synchronization of all devices of the system, and a convenient imaging experience thanks to an intuitive and reliable software interface. Such a system can be used in a large spectrum of applications including oncology, development studies, the biodistribution of labeled molecules or characterization of biological structures (nervous system, blood, and/or lymphatic vessels, …).


Bibliography

  1. Gieniec KA & Davis FM (2022) Mammary basal cells: Stars of the show. Biochim Biophys Acta BBA – Mol Cell Res 1869: 1–6
  2. Guyot M, Simon T, Ceppo F, Panzolini C, Guyon A, Lavergne J, Murris E, Daoudlarian D, Brusini R, Zarif H, et al (2019a) Pancreatic nerve electrostimulation inhibits recent-onset autoimmune diabetes. Nat Biotechnol 37: 1446–1451
  3. Guyot M, Simon T, Panzolini C, Ceppo F, Daoudlarian D, Murris E, Macia E, Abélanet S, Sridhar A, Vervoordeldonk MJ, et al (2019b) Apical splenic nerve electrical stimulation discloses an anti-inflammatory pathway relying on adrenergic and nicotinic receptors in myeloid cells. Brain Behav Immun 80: 238–246
  4. Huisken J, Swoger J, Del Bene F, Wittbrodt J & Stelzer EHK (2004) Optical Sectioning Deep Inside Live Embryos by Selective Plane Illumination Microscopy. Science 305: 1007–1009
  5. Renier N, Adams EL, Kirst C, Wu Z, Azevedo R, Kohl J, Autry AE, Kadiri L, Umadevi Venkataraju K, Zhou Y, et al (2016) Mapping of Brain Activity by Automated Volume Analysis of Immediate Early Genes. Cell: 1789–1802
  6. Richardson DS & Lichtman JW (2015) Clarifying Tissue Clearing. Cell 162: 246–257
  7. Siedentopf H & Zsigmondy R (1902) Uber Sichtbarmachung und Größenbestimmung ultramikoskopischer Teilchen, mit besonderer Anwendung auf Goldrubingläser. Drudes Ann Phys: 1–39
  8. Simon T, Pogu J, Rémy S, Brau F, Pogu S, Maquigneau M, Fonteneau J-F, Poirier N, Vanhove B, Blancho G, et al (2017) Inhibition of effector antigen-specific T cells by intradermal administration of heme oxygenase-1 inducers. J Autoimmun 81: 44–55
  9. Voie AH, Burns DH & Spelman FA (1993) Orthogonal-plane fluorescence optical sectioning: Three-dimensional imaging of macroscopic biological specimens. J Microsc: 229–236
  10. Wang K, Milkie DE, Saxena A, Engerer P, Misgeld T, Bronner ME, Mumm J & Betzig E (2014) Rapid adaptive optical recovery of optimal resolution over large volumes. Nat Methods 11: 625–628
Monitoring of kinase activation using FRET biosensor on living cells with Inscoper fastFLIM

Monitoring of kinase activation using FRET biosensor on living cells with Inscoper fastFLIM

Inscoper fastFLIM applications

The Inscoper fastFLIM, a camera-based time-domain fluorescence lifetime imaging microscopy (FLIM) system, is the fastest lifetime imaging technique designed for live cell experiments. This technology can be used :

  • to follow molecular interaction and biochemical activities;
  • to monitor in real-time the molecular conformational changes by Förster’s Resonance Energy Transfer (FRET);
  • to characterize autofluorescence;
  • to determine lifetime biosensors for ions concentration;
  • to measure the dynamic pH changes with spatial correlation.

Here, this video highlights the way the Inscoper fastFLIM can monitor in real time the activation of protein using fluorescent biosensors relying on the principles of FRET-FLIM.

Aurora kinase A autophosphorylation

Aurora kinase A (AURKA) is a serine-threonine kinase implicated in a large panel of biological pathways that activate upon its autophosphorylation of Thr288. One of its functions is to control the stability and fidelity of the mitotic spindle and the overall efficiency of mitosis. Although well characterized at the structural level, consistent monitoring of the activation of AURKA throughout the cell cycle is lacking. Characterization of the AURKA autophosphorylation is made possible using genetically-encoded FRET biosensors. 

Protocol to engineer FRET biosensors

In this video made by the Journal of Visualized Experiments, Dr. Bertolin describes a protocol to engineer FRET biosensors detecting Thr288 autophosphorylation, and how to follow this modification during mitosis (Bertolin et al, 2020). First, possible donor/acceptor FRET pairs are presented, and the research team shows possible cloning and insertion methods of AURKA FRET biosensors in cells. Then, a step-by-step analysis is realized for rapid FRET measurements by FLIM using the Inscoper fastFLIM. The easy-to-use graphical interface allows customization of the acquisition sequence. 

The Inscoper fastFLIM provides biological researchers a versatile tool to monitor in real time lifetime changes on biosensors with a high spatiotemporal resolution.