Fluorescence phenomenon in microscopy can be characterized by its intensity, but also by the time between the excitation of a fluorescent molecule and the emission of the corresponding photon. This measure of time is a microscopy technique called FLIM, for “Fluorescence Lifetime Imaging Microscopy’’. Here, we present a new opportunity for biological researchers to equip their microscope with the combination of the specialized pco.flim camera from Excelitas PCO (Germany) and the Imaging Solution, for microscope automation and image acquisition workflow from INSCOPER (France).
FLUORESCENCE-LIFETIME IMAGING FOR LIFE SCIENCE
Fluorescence is nowadays one of the most widely used techniques for the identification and localization of proteins in cells when coupled with specific antibodies or fused with proteins of interest (Moore & Morse, 1988; Lin et al, 2015). It is a phenomenon that consists of the absorption of light (ultraviolet or visible light), followed by the emission of photons with lower energy. Briefly, when a molecule (chemicals, protein, …) is excited at the appropriate wavelength, electrons change from a ground state to an excited state. When the molecule returns to the ground state, energy is released with photons emissions at a different longer wavelength of lower energy (Lakowicz, 2006).
Characterization of fluorescence signals can be done using its intensity, but also measuring its lifetime (time that a molecule stays in the excited state (S1) before going back to the ground state (S0) after excitation) or decay time (fluorescence decay curve after excitation). These measurements are performed using FLIM, for “Fluorescence-lifetime imaging microscopy”. Lifetime imaging allows the visualization and analysis of different structures and/or metabolic processes. One of the main applications of FLIM is to measure the Förster Resonance Energy Transfer (FRET), which allows to evaluate the proximity between two labeled-molecules or to monitor fluorescent biosensors.
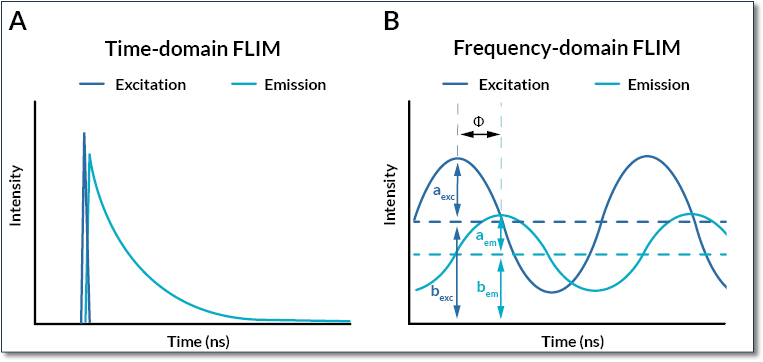
There are two technical approaches (Figure 1) to measure fluorescence lifetimes, each with advantages and disadvantages.

Figure 1: Time- and frequency-domain measurements for FLIM
A representative overview of excitation (blue) and emission (turquoise) signals in time- and frequency-domain FLIM. (A) For the time-domain approach, excitation is performed using a pulsed laser and the fluorescence decay is directly measured. The fluorescence lifetime is measured by fitting the fluorescence decay. (B) For the frequency-domain, the excitation laser is continuously modulated and the emission signal is recovered. Some parameters including the amplitude (aexc and aem), the constant and direct components (bexc and bem) and the phase shift (Φ) are then used to determine the fluorescence lifetime.
1. The time-domain FLIM method consists of acquiring the decay curve of fluorescence (Delbarre et al, 2006). The most commonly used method is the TCSPC (Time Correlated Single Photon Counting). Using a pulsed laser, it can detect photons individually and reconstruct a decay curve to determine the exact fluorescence lifetime. This technique is suitable with mixed signals (multiexponential lifetime signals), fast signals with short lifetime and weak signals (sensitive technique). The main limitation is a slow acquisition speed, which makes this technique incompatible with the imaging of various rapid biological processes. The alternative technology is to combine the pulsed laser with a camera detector and a time-gate generation device, such as the Inscoper fastFLIM (Leray et al, 2013; Sizaire et al, 2020), which offers less spatial resolution but far higher acquisition frame rate for live cell imaging.
2. With the frequency-domain method, the excitation signal is continuously modulated (Lakowicz et al, 1992a, 1992b). Here, excitation and emission signals are compared to determine the decay curve. The emitted signal is detected with a smaller amplitude and with a delay compared to the excitation light. Some iterations are needed to average the signal and get lifetime values. The main advantage of the frequency-domain FLIM method is to be compatible with the imaging of the fastest phenomena in living cells thanks to a high acquisition speed.
pco.flim camera for FLIM imaging in frequency-domain
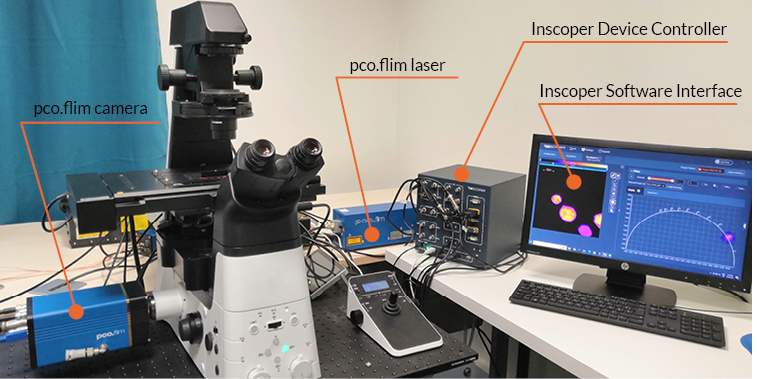
Excelitas PCO (Kelheim, Germany) has developed a camera for FLIM imaging in frequency-domain, called pco.flim. This technology is based on a fast CMOS sensor camera that can be attached to every microscope through C-mount camera port (Figure 2). The camera controls the modulation of the specific pco.flim laser with a frequency range from 5kHz to 40MHz, and reconstructs the emission signal to determine fluorescence lifetime values. At a maximum modulation frequency of 40 MHz, a minimum half period integration interval of 12.5 nanoseconds can be achieved. It can be used for the measurements of a huge range of lifetimes from tenth of microseconds down to 100 ps. All information is specified below (Table I).
| Camera resolution | 1008 x 1008 pixels |
| Pixel size | 5.6 x 5.6 µm |
| Quantum efficiency | Up to 39% |
| Adaptation on microscopes | All microscopes using C-mount |
| Lifetimes detection range | 100 ps to 100 µs |
| Frame rate | Up to 45 double frames/s |
| Frequency modulation | 5 kHz to 40 MHz |
| Selectable exposure time | 1 ms to 2 s |
| Dynamic range | 14 bit |
| Power consumption | 40 W |
Table I. Technical data of the pco.flim camera (source: www.pco.de)
Inscoper Imaging Solution for seamless software integration
INSCOPER (Cesson-Sévigné, France) is a company specialized in image acquisition and device control in the field of microscopy. The company has developed a universal solution to be compatible with all camera-based microscopes and dedicated to a large panel of applications such as live cell imaging, ratiometric imaging, light-sheet microscopy, super-resolution, photomanipulation (FRAP) or FLIM imaging. It can be used on commercial microscopes (from Leica, Nikon, Evident (Olympus) and Zeiss) to enable the interoperability between devices of different brands (cameras such as the pco.flim from Excelitas PCO, stages, light sources, spinning disk modules, …) or to turn home-built setups into commercial-grade systems for regular biology users. In all situations, the user-friendly graphical user interface allows the full control and combination of all motorized devices, customizable calibration protocols, multidimensional acquisition (time, XYZ, channels, multi-positions, tiling) and image visualization.
The Inscoper technology also improves the temporal resolution of acquisitions by removing all software latency and optimizing the synchronization of the elements of the microscope, which is a key advantage for live cell imaging.
Figure 2: Microscope setup equipped with pco.flim module using an Inscoper Imaging Solution (I.S.) including device controller and software interface
This setup used for frequency-domain FLIM imaging is composed of a microscope, a pco.flim camera and laser. All these elements are connected to the Inscoper device controller for automation and synchronization. The software interface allows the user to customize the image acquisition sequence and process and visualize the data.
Pco.flim applications in the Inscoper environment
The pco.flim solution is fully integrated in the Inscoper environment. It opens its use with all microscope brands in the market and in combination with other imaging techniques on a same system.
In this use case, the system is composed by a Ti2 Eclipse microscope (Nikon, Tokyo, Japan) with a Plan Apo λ 60x 1.4 NA oil immersion objective (MRD01605; Nikon), a complete pco.flim system with camera, modulable laser and frequency synthesizer (Excelitas PCO). All elements are controlled and synchronized by the Inscoper Imaging Solution (INSCOPER).
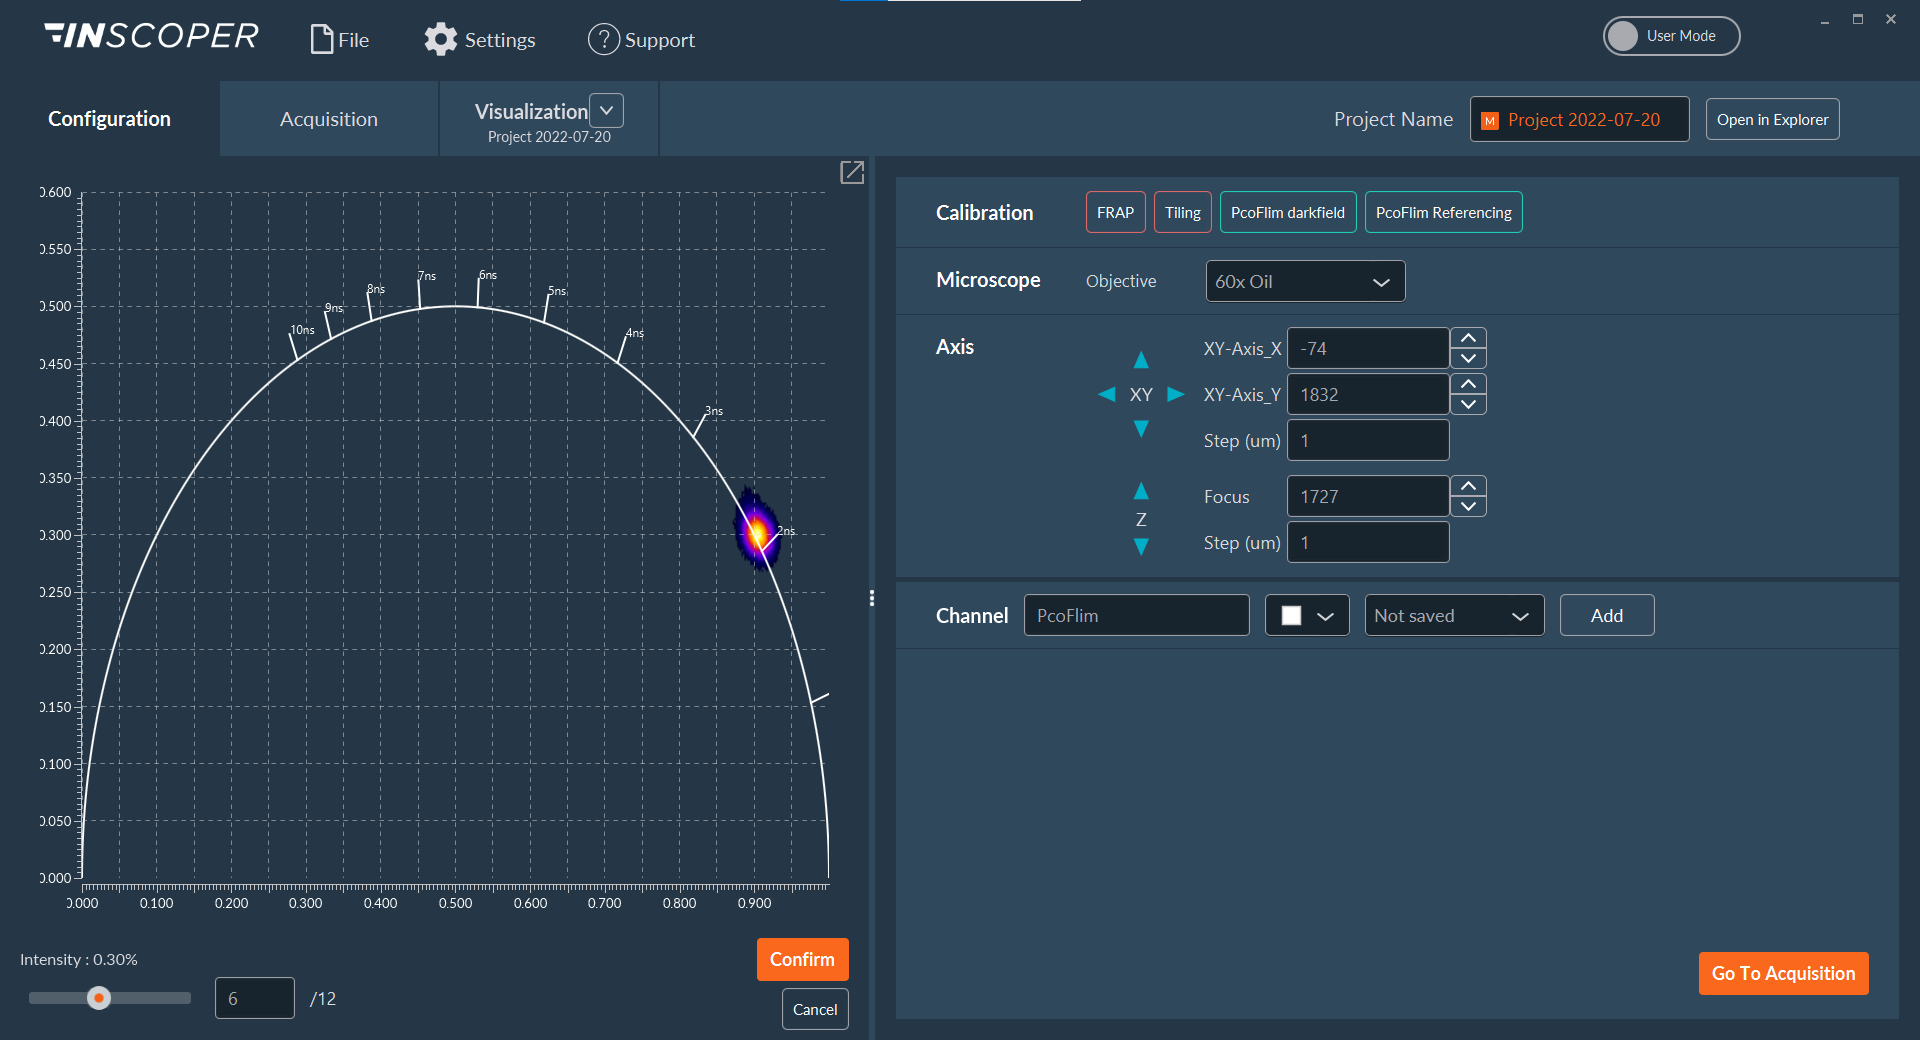
FLIM imaging is simple to perform with the pco.flim solution, even for the initial calibration. Two calibration steps are indeed required prior to proceeding to FLIM measurements: darkfield imaging and referencing using a fluorescent sample with known lifetime. An automated protocol allows to reduce the time spent on this step and facilitate its use (Figure 3).
Figure 3: Automated calibration protocol for pco.flim module using Inscoper Imaging Solution
Two calibration protocols, darkfield measurement and referencing, are needed before imaging samples of interest. This step is quite tedious and time-consuming when performed manually. With Inscoper, both protocols are fully integrated and automated to facilitate the user experience with pco.flim. Here, a sample with a known fluorescence lifetime was observed on a phasor plot to validate the calibration (2.13 ns).
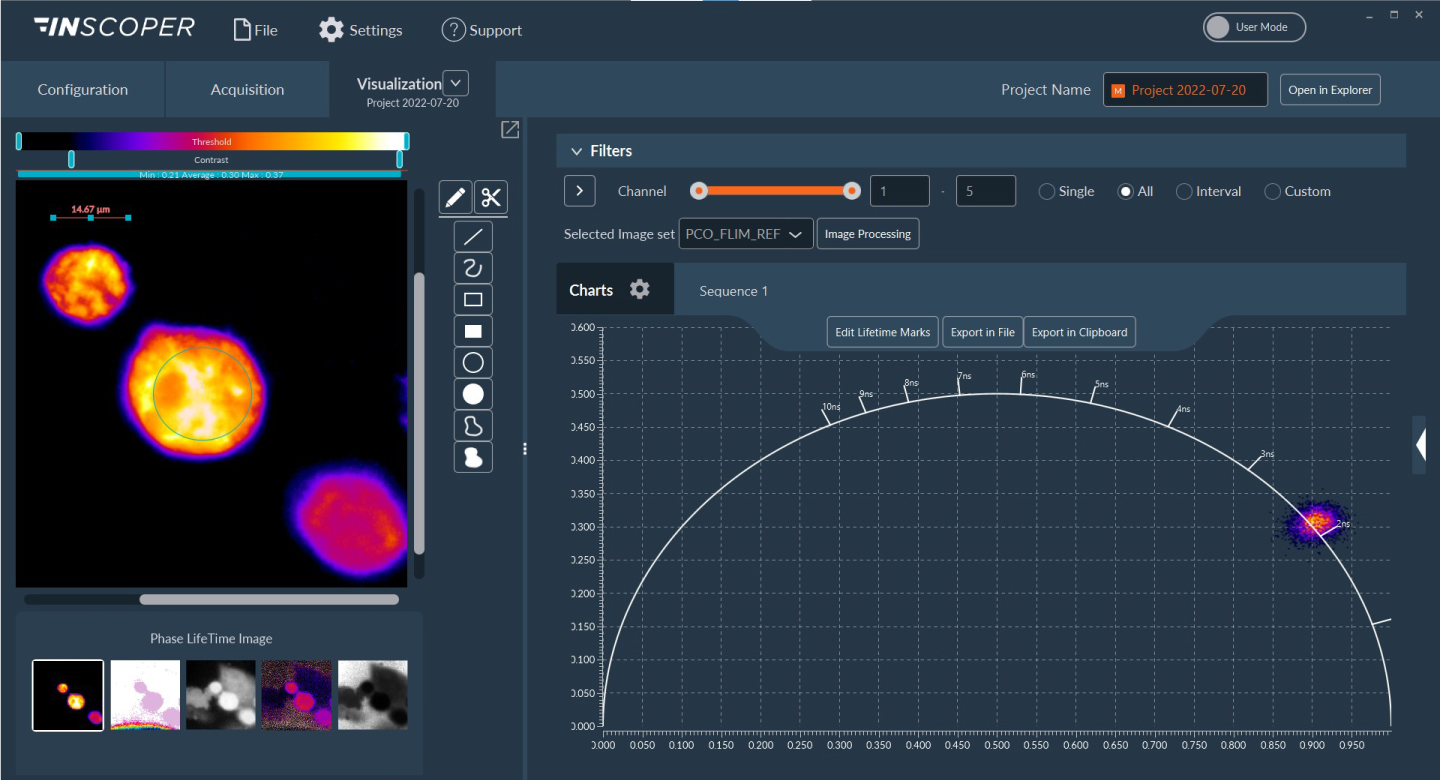
The pco.flim solution is a powerful frequency domain FLIM technique suitable for live cell imaging (Figure 4). It can be used for different applications including
- autofluorescence imaging of molecules including NAD(P)H or FAD
- FRET microscopy
- biosensor imaging of biological processes
- optical chemical sensing
- cancer margin detection
- solar cell research.
Figure 4. FLIM measurements on HeLa cells using pco.flim module
Fluorescence lifetime can be determined in a phasor plot (right part of the window). Regions of interest can be drawn on the image to compare values from different areas. All these data can be exported in .tif (images) and in .csv (raw data).
Summary
The pco.flim has been fully integrated in the Inscoper environment to offer a seamless microscopy solution for biologists, compatible with their microscope systems and non-FLIM imaging techniques. Benefiting from the optimized performance of the Inscoper Imaging Solution, the pco.flim allows the fast imaging of living cells to characterize fluorescence lifetimes. Both solutions can be adapted on all microscopes to equip them with the FLIM imaging technique, which provides complementary information of the sample compared to conventional intensity measurements.
Bibliography
- Delbarre E, Tramier M, Coppey-Moisan M, Gaillard C, Courvalin J-C & Buendia B (2006) The truncated prelamin A in Hutchinson–Gilford progeria syndrome alters segregation of A-type and B-type lamin homopolymers. Hum Mol Genet 15: 1113–1122
- Lakowicz JR ed. (2006) Principles of Fluorescence Spectroscopy Boston, MA: Springer US
- Lakowicz JR, Szmacinski H, Nowaczyk K, Berndt KW & Johnson M (1992a) Fluorescence lifetime imaging. Anal Biochem 202: 316–330
- Lakowicz JR, Szmacinski H, Nowaczyk K & Johnson ML (1992b) Fluorescence lifetime imaging of free and protein-bound NADH. Proc Natl Acad Sci 89: 1271–1275
- Leray A, Padilla-Parra S, Roul J, Héliot L & Tramier M (2013) Spatio-Temporal Quantification of FRET in Living Cells by Fast Time-Domain FLIM: A Comparative Study of Non-Fitting Methods. PLoS ONE 8: 1–16
- Lin J-R, Fallahi-Sichani M & Sorger PK (2015) Highly multiplexed imaging of single cells using a high-throughput cyclic immunofluorescence method. Nat Commun 6: 1–7
- Moore PB & Morse SS (1988) Cellular immunofluorescence: Quantification of low abundance proteins. Anal Biochem 173: 49–53
- Sizaire F, Le Marchand G, Pécréaux J, Bouchareb O & Tramier M (2020) Automated screening of AURKA activity based on a genetically encoded FRET biosensor using fluorescence lifetime imaging microscopy. Methods Appl Fluoresc 8: 1–21


0 Comments